Stage-Gate Process Flowchart Template
Improve decision-making, mitigate risks, and drive project success with the stage-gate process flowchart template.
Trusted by 65M+ users and leading companies


About the Stage-Gate Process Flowchart Template
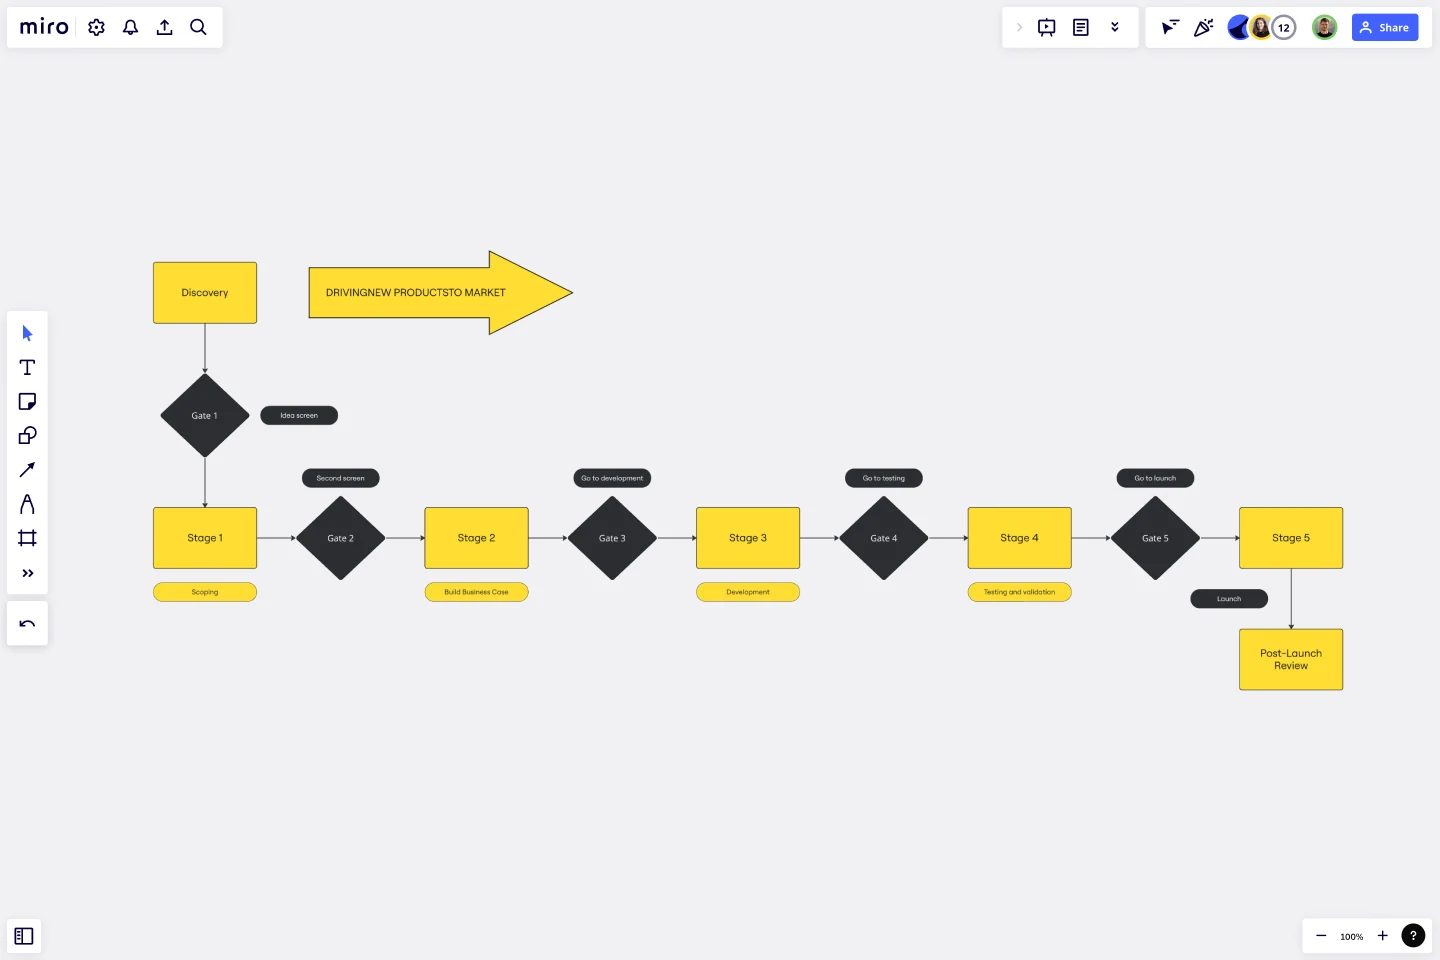
The Stage-Gate Process Flowchart Template is a significant asset for project management, designed to simplify the advancement of projects through different stages. This template provides a systematic approach that helps teams efficiently manage and monitor each phase of a project, starting from the beginning to completion. It guides teams through a sequence of checkpoints or "gates" where decisions are made before moving on to the subsequent stage.
This template is divided into sections representing a project's various stages and decision points. Each stage signifies a key phase in the project, such as ideation, planning, execution, and review. The decision points, positioned between stages, serve as checkpoints where progress is evaluated, and a decision is made to either continue, change, or stop the project. Using this template, you can systematically track progress, identify potential issues early on, and ensure that each project phase aligns with the objectives.
How to use the Stage-Gate Process Flowchart Template in Miro
Customize the template: Easily edit the template with just a few clicks. Change the stage names and descriptions to suit the project's specific needs.
Expand with diagramming tools: Use Miro's automated diagramming features to add more shapes and connector lines, enriching the flowchart with additional details and complexities as needed.
Integrate artifacts: Enhance the flowchart by adding any relevant artifacts directly onto the Miro board. This could include documents, images, or links, providing context and information at each stage.
Collaborate and share: Invite team members to view, edit, and comment on the flowchart, fostering a collaborative environment where everyone stays informed and aligned.
Why should you use a Stage-Gate Process Flowchart Template?
Improved project clarity: Clearly define each project stage, ensuring team members understand their roles and responsibilities at every phase.
Informed decision-making: The gate checkpoints facilitate informed decisions based on thorough project progress and feasibility evaluations.
Risk mitigation: Early identification and management of potential risks and issues, reducing the likelihood of project delays or failures.
Efficient resource allocation: Allows for the best distribution and utilization of resources throughout the project lifecycle.
Facilitates communication: Provides a visual representation of the project plan, improving Communication and understanding among stakeholders.
Can the template be customized for different project types?
Yes, the template is highly adaptable and can be tailored to fit a wide range of project types and industries.
How does the template assist in risk management?
The template allows for regular assessments at each gate, enabling teams to identify and address risks early in the project lifecycle.
Get started with this template right now.
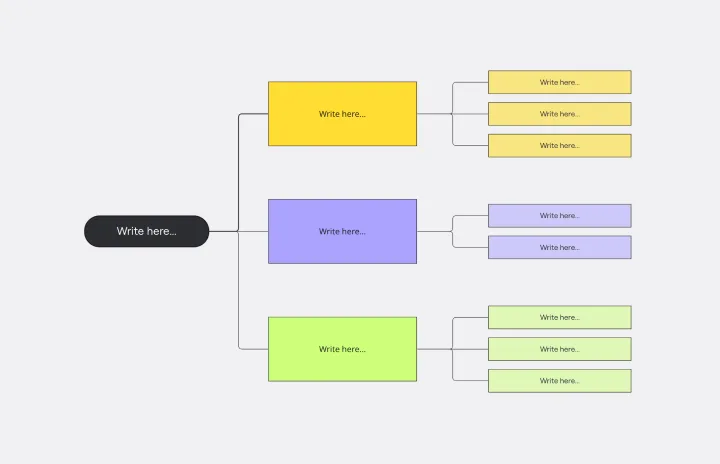
Brace Map Template
Works best for:
Diagramming, Planning
Transform your brainstorming and planning tasks with Miro's Brace Map Template. This powerful visual thinking tool clarifies complex concepts by creating a visual hierarchy that organizes each element precisely. The central idea connects seamlessly to sub-elements through intuitive braces, providing an easily understandable framework. This clarity enhances individual understanding and fosters collaborative efforts, allowing teams to navigate complex ideas with precision and coherence. The Brace Map Template will enable you to organize your thoughts efficiently and solve complexities visually.
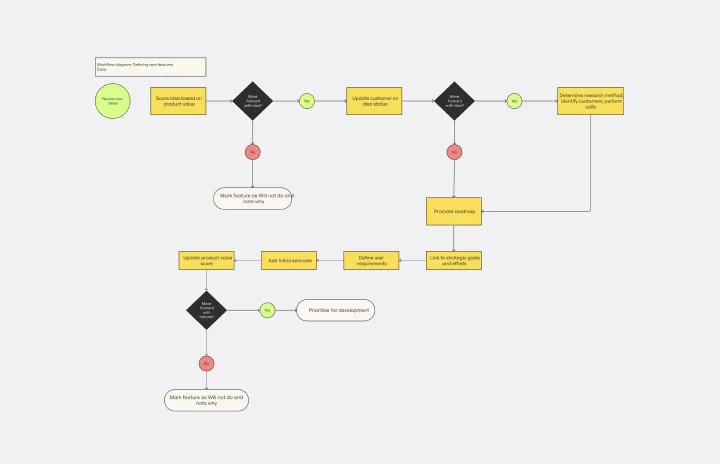
Workflow Diagram Template
Works best for:
Diagramming, Mapping, Process mapping
The Workflow Diagram Template maps out and represents processes or systems using standardized symbols and shapes. By delineating the various steps or stages in a process, it ensures that tasks flow seamlessly from initiation to completion. One of the standout benefits of using this template is its clarity. By translating processes into a visual format, all participants can gain a comprehensive understanding at a glance, eliminating confusion and ensuring everyone is on the same page. This clarity not only promotes efficient task execution but also fosters collaboration among team members.
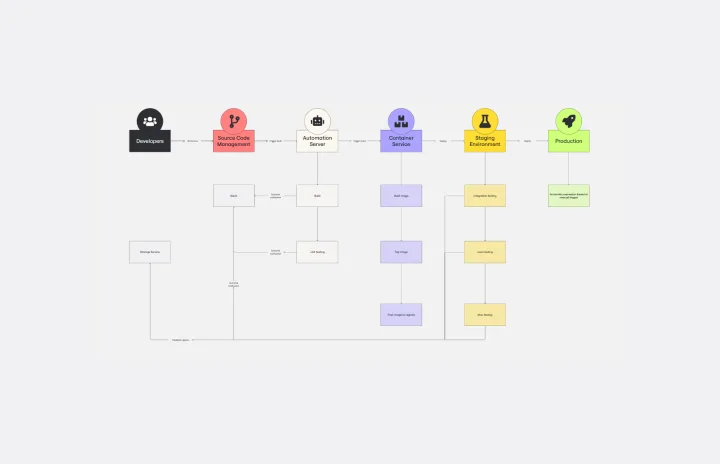
CI/CD Pipeline Diagram Template
Works best for:
Diagramming, Development
The CI/CD template is a well-designed roadmap for software deployment that enables a smooth and automated flow from development to production. This strategic layout includes critical elements such as source code management, automation servers, container orchestration, staging environments, and the final deployment to production. One of the key benefits of using such a template is that it builds a robust deployment pipeline, which significantly reduces manual intervention and human error. By visualizing each step and integrating automation throughout, teams can achieve faster deployment cycles, ensuring that new features, updates, and fixes are delivered to users promptly and reliably. This enhanced pace does not compromise quality, as the template inherently supports continuous testing and quality assurance, ensuring that each update is quick but also secure and stable before it is delivered to the end user.
Flowchart Template
Works best for:
Flowcharts, Mapping, Diagrams
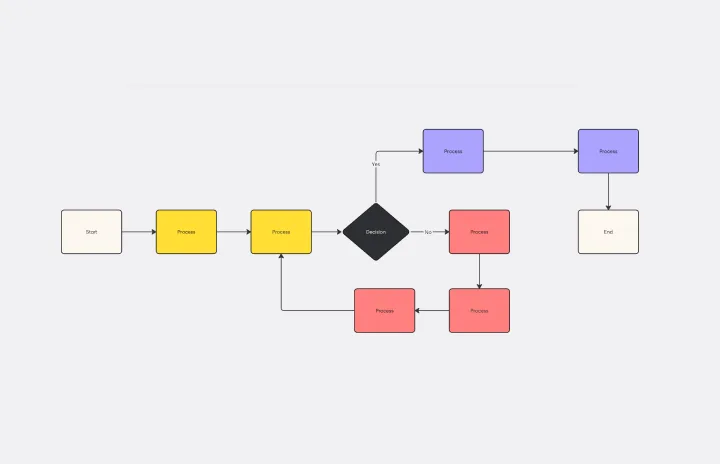
Trying to explain a process or workflow to your team — or just wrap your head around it yourself? Sometimes the best way is to see it, and that’s when you create a flowchart. Using common shapes (generally just ovals, rectangles, diamonds, and arrows), a flowchart shows you the direction a process or workflow goes and the order of steps. Beyond giving you a clear understanding, you’ll also be able to see potential flaws and bottlenecks, which helps you refine and improve your process and create a better product more efficiently.
Kubernetes Architecture Diagram Template
Works best for:
Software Development, Diagrams
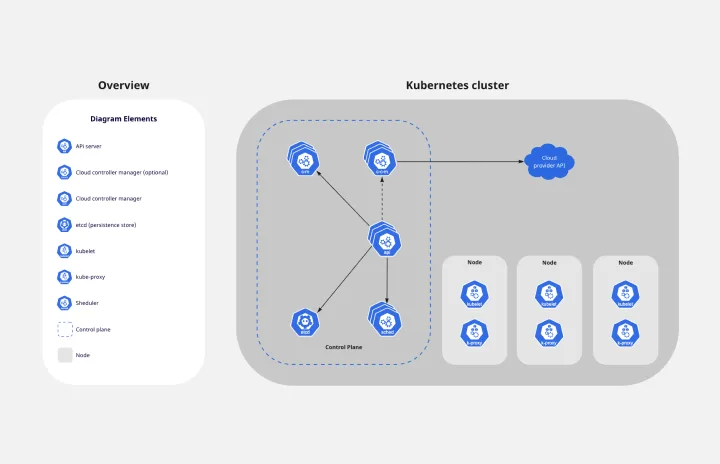
Use the Kubernetes Architecture Diagram template to manage your containerized applications better and bring your apps’ deployment, management, and scalability to the next level. This template helps you lower the downtime in production and allows you to have a more agile app production. Improve the deployment of your apps by visualizing every step of the process with the Kubernetes Architecture template. Try it out, and see if it works for you and your team.
Dichotomous Key Template
Works best for:
Diagramming
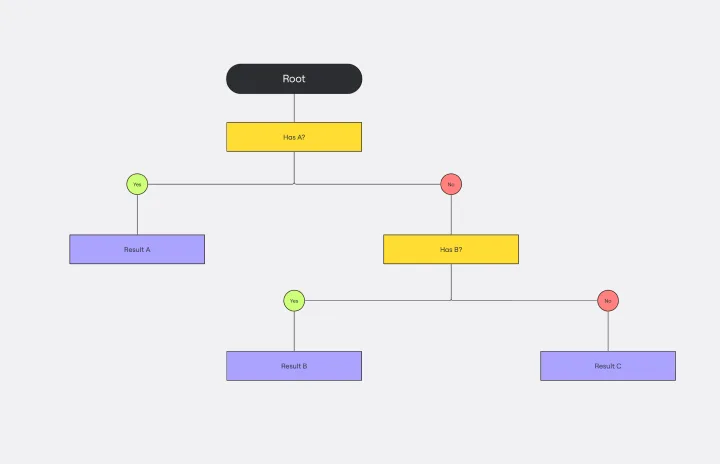
The Dichotomous Key Template stands out as an exceptional tool for simplifying complex classification processes, significantly enhancing learning experiences. Breaking down intricate subjects into a series of binary decisions transforms how information is absorbed and understood. This systematic approach not only aids in retaining intricate details but also makes the learning process more engaging and interactive. Whether for educational purposes or professional use, the template’s design fosters a deeper comprehension of the subject matter, allowing learners and professionals to navigate complex scenarios with clarity and ease.