Production Flowchart Template
Map processes from start to finish and reduce complexity with the production flowchart template.
Trusted by 65M+ users and leading companies


About the Production Flowchart Template
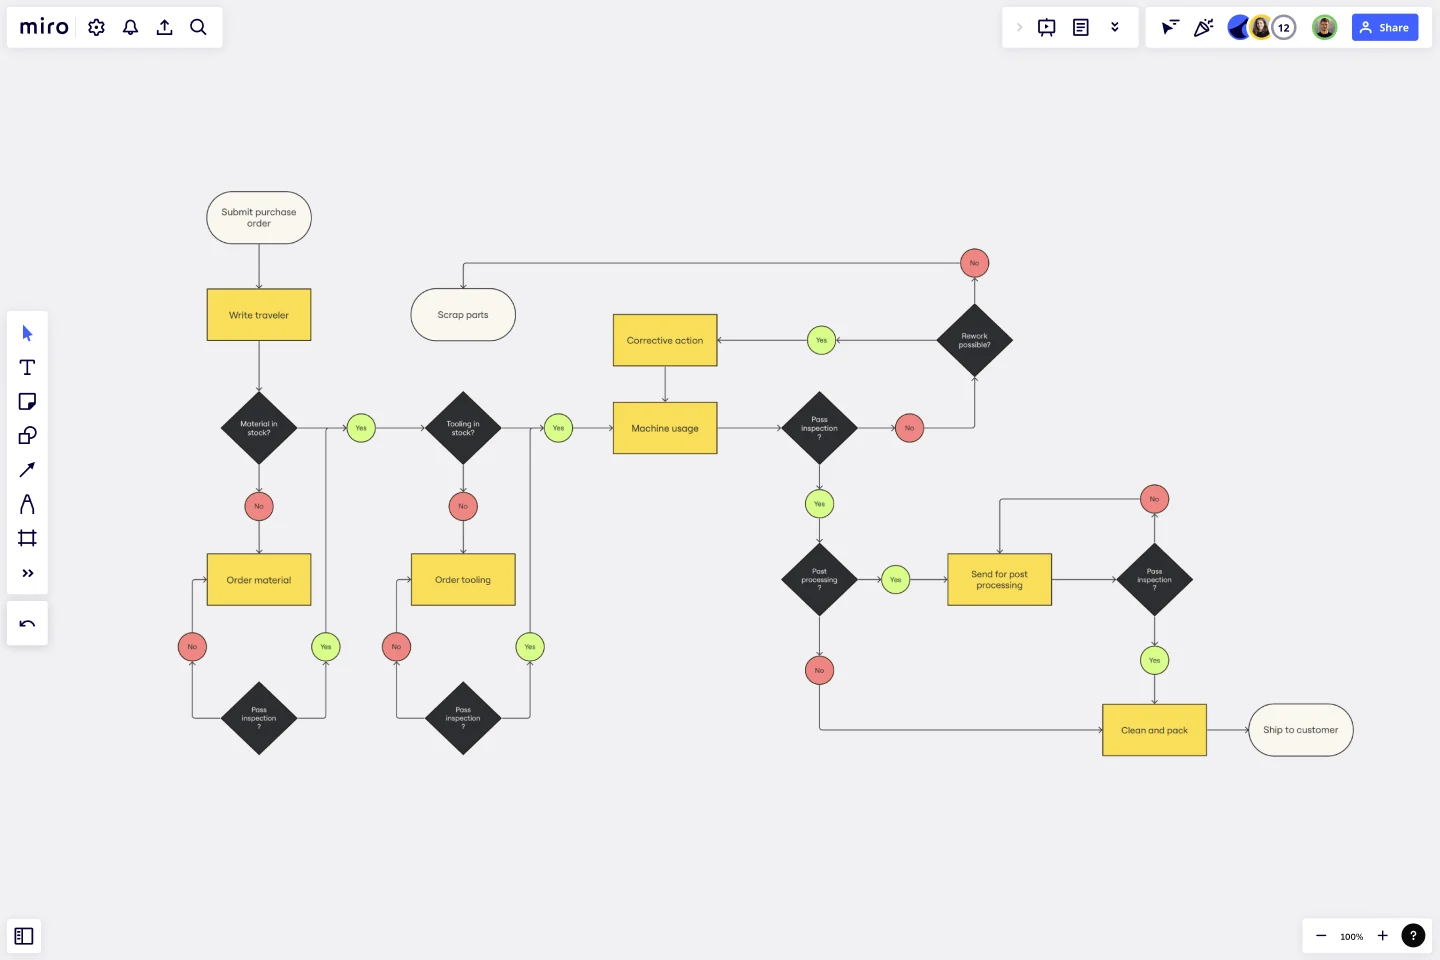
Do you want to simplify your production processes? Use the production flowchart template to break down each step, visualizing the production flow and spot areas for optimization.
The template consists of a pre-designed diagram that showcases the systematic breakdown of the production process. Each area of the template signifies a distinct phase or step in the process, making it easier to understand the progression of tasks.
The production flowchart template contains the following attributes:
Shapes: These represent different steps or processes. They can be customized to differentiate tasks, departments, or stages.
Connector Lines: These link the shapes together, indicating the sequence or flow between tasks.
Annotations: Useful for adding extra information or context about a particular process or step.
Colors: Can be applied to shapes or lines to categorize or prioritize processes.
This template can be customized to meet the unique requirements of any production, making it the perfect solution for your needs.
How to use the production flowchart template in Miro
Add your production flow: Open the template and edit the shapes, colors, and texts to represent your production process.
Expand the flowchart: Use Miro’s automated diagramming features to add more shapes and connector lines until your production process is accurately represented.
Add any extra context: Integrate other artifacts or elements on the board to provide any additional context that helps visualize or understand your production process.
Why should you use a production flowchart template?
Breaking down a production process from start to finish makes it easy to visualize complex operations. In addition to serving as a useful guide, this template has many benefits:
Provides clarity: A detailed flowchart provides a clear visualization of the production process, making it easier for all involved to understand.
Efficiency: Identifying and rectifying bottlenecks becomes straightforward when each step of the process is mapped out.
Collaboration: Team members can collaborate in real time, offering suggestions and improvements.
Optimization: With a comprehensive overview, teams can streamline operations, reducing costs and improving output.
Documentation: The template acts as a reference point, ensuring everyone follows the established procedures. The template is easy to update as the production process changes, ensuring the most up-to-date version is always shared.
If you'd prefer to start from scratch, Miro's easy flowchart tool will help you build an online flowchart in no time. With Miro's collaboration features, you can workshop it with your team and easily share it with others for feedback with tagging, comments and sticky notes.
Can I customize the shapes and colors of the template?
Absolutely! The template is designed for full customization, allowing you to adjust shapes, colors, and text to represent your process best.
Is it suitable for all types of production processes?
Yes, the template is versatile and can be used for different types of productions. Whether you're mapping a simple or complex process, the template can be adapted to fit your needs.
How can I collaborate with team members using this template?
Miro allows for real-time collaboration. Team members can simultaneously view, edit, and comment, making collective input seamless.
Are there any limitations to how much I can expand the template?
With Miro’s infinite canvas, you can expand the template as much as you need — and if things get too expansive, simply zoom out or rearrange for clarity.
Get started with this template right now.
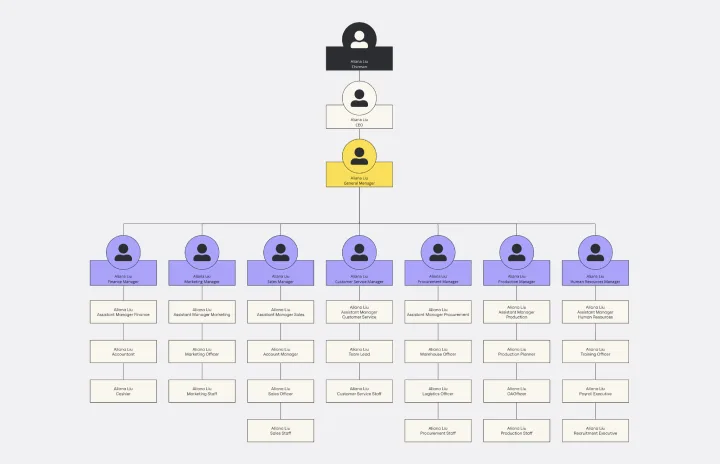
Vertical Organizational Chart
Works best for:
Diagramming, Organizational Charts, Organizational Design
The Vertical Organizational Chart Template is an efficient way to illustrate the hierarchy of an entity in a top-down format. This tool helps represent roles and relationships in a clear manner, starting from the topmost authority and branching downwards. It allows for a better understanding of the flow of responsibilities and communication channels within the organization. One of its most significant advantages is promoting clear communication. Depicting the organization's structure helps avoid misunderstandings and ensures everyone is on the same page regarding the chain of command.
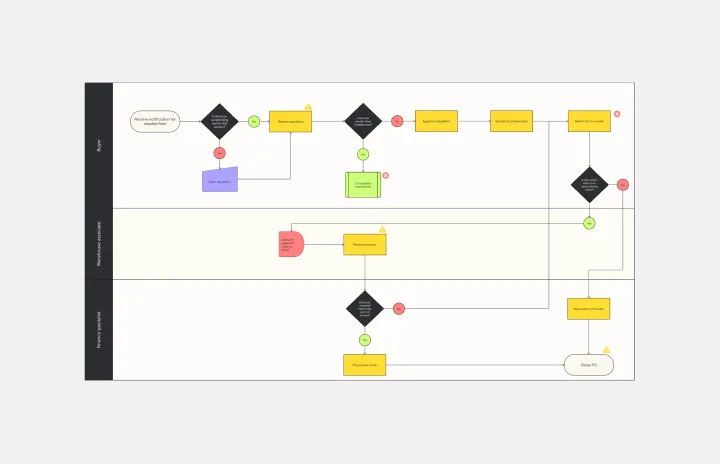
Current State vs. Future State Flowchart Template
Works best for:
Diagramming
The Current State vs Future State Flowchart Template is an essential tool for strategic planning, providing teams with a dynamic and visual roadmap for organizational transformation. One of its key benefits is streamlining collaboration by using swimlanes to allocate tasks to specific departments. This feature promotes accountability and transparent communication, ensuring everyone is aligned on their responsibilities. As a result, teams can navigate complex processes with ease, fostering a shared understanding of the current and future states, ultimately leading to efficient and collaborative decision-making.
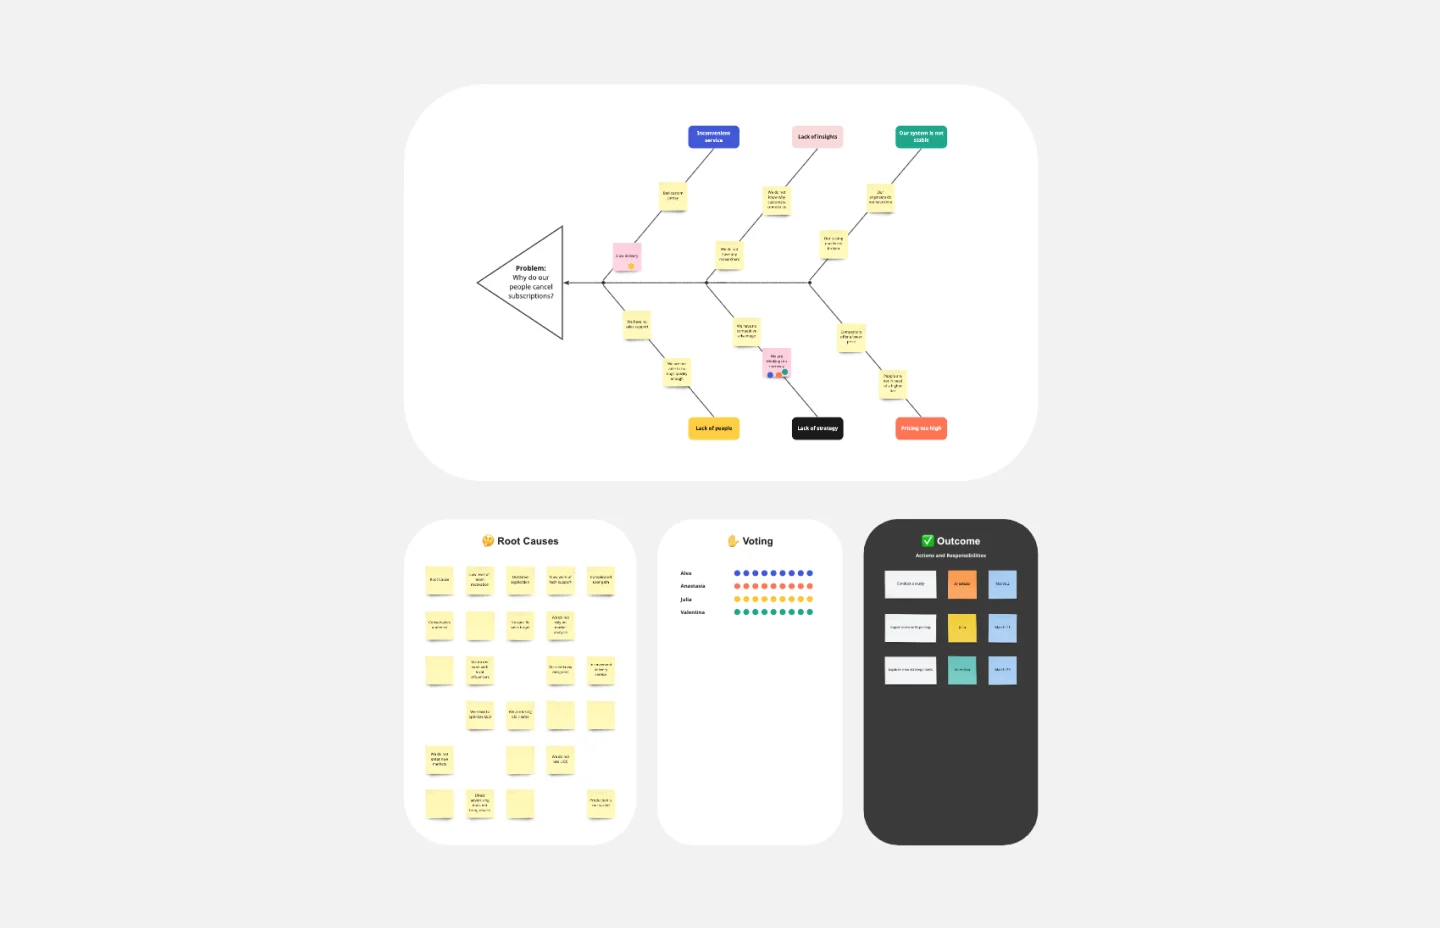
Fishbone Diagram Template
Works best for:
Operations, Diagrams, Workflows
What is the best way to solve any problem your team faces? Go straight to the root. That means identifying the root causes of the problem, and fishbone diagrams are designed to help you do it best. Also known as the Ishikawa Diagram (named after Japanese quality control expert Kaoru Ishikawa), fishbone diagrams allow teams to visualize all possible causes of a problem, to explore and understand how they fit together holistically. Teams can also use fishbone diagrams as a starting point for thinking about what the root cause of a future problem might be.
Design Process Flowchart Template
Works best for:
Flowchart, Diagramming
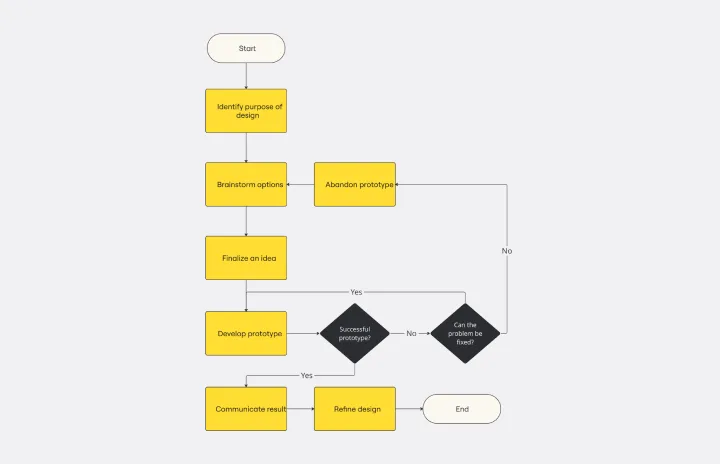
The Design Process Flowchart Template is an excellent tool to navigate the complexities of a design project. It offers a clear and organized visual representation of each step in the design journey, making it easier to understand and follow. One of its key benefits is that it enhances team collaboration. By providing a visual outline of the design process, the template fosters a shared understanding among team members, regardless of their individual roles or expertise. This common visual framework enables more efficient communication, aligning everyone's efforts toward a unified goal. As a result, it not only streamlines the workflow but also encourages collective creativity and innovation, which are essential elements in any successful design project.
Use Case Diagram Template
Works best for:
Marketing, Market Research, Diagrams
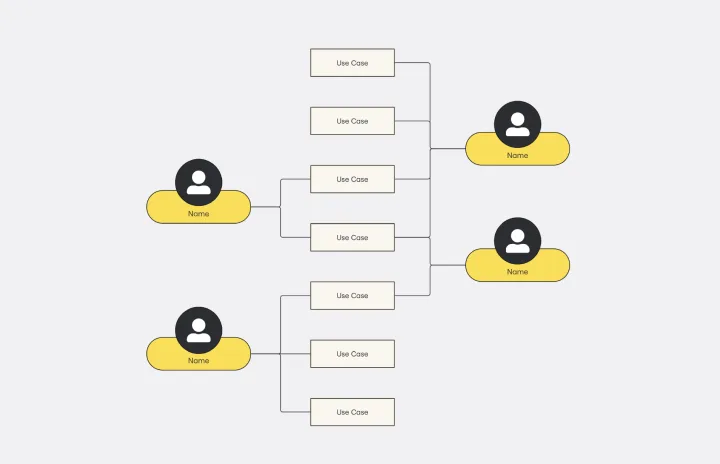
A use case diagram is a visual tool that helps you analyze the relationships between personas and use cases. Use case diagrams typically depict the expected behavior of the system: what will happen and when. A use case diagram is helpful because it allows you to design a system from the perspective of the end user. It’s a valuable tool for communicating your desired system behavior in the language of the user, by specifying all externally visible system behavior.

Azure Demand Forecasting Template
Works best for:
Software Development, Diagrams
The Azure Demand Forecasting diagram will show the architecture of a demand forecast, making it easier for you to predict data consumption, costs, and forecast results. Azure is Microsoft’s cloud computing platform, designed to provide cloud-based services such as remote storage, database hosting, and centralized account management. Azure also offers new capabilities like AI and the Internet of Things (IoT).