Pedigree Diagram Template
Map genetic traits to family members with a pedigree diagram.
Trusted by 65M+ users and leading companies


About the Pedigree Diagram Template
You can identify how traits and diseases are passed from one generation to the next using the pedigree diagram template. Pedigree Diagrams are useful for doctors, veterinarians, farmers, and anyone else working with genes or interested in genetics.
What is a pedigree diagram?
A pedigree diagram is an advanced version of a family tree, that is commonly used to diagram relationships within family members. It shows how genetic traits and diseases are passed from one generation to the next.
You can use a pedigree diagram to see which family members carry a certain trait, like a widow’s peak. Doctors use them to see how diseases are passed from parents to children. Farmers use it in husbandry to track traits in crops and animals.
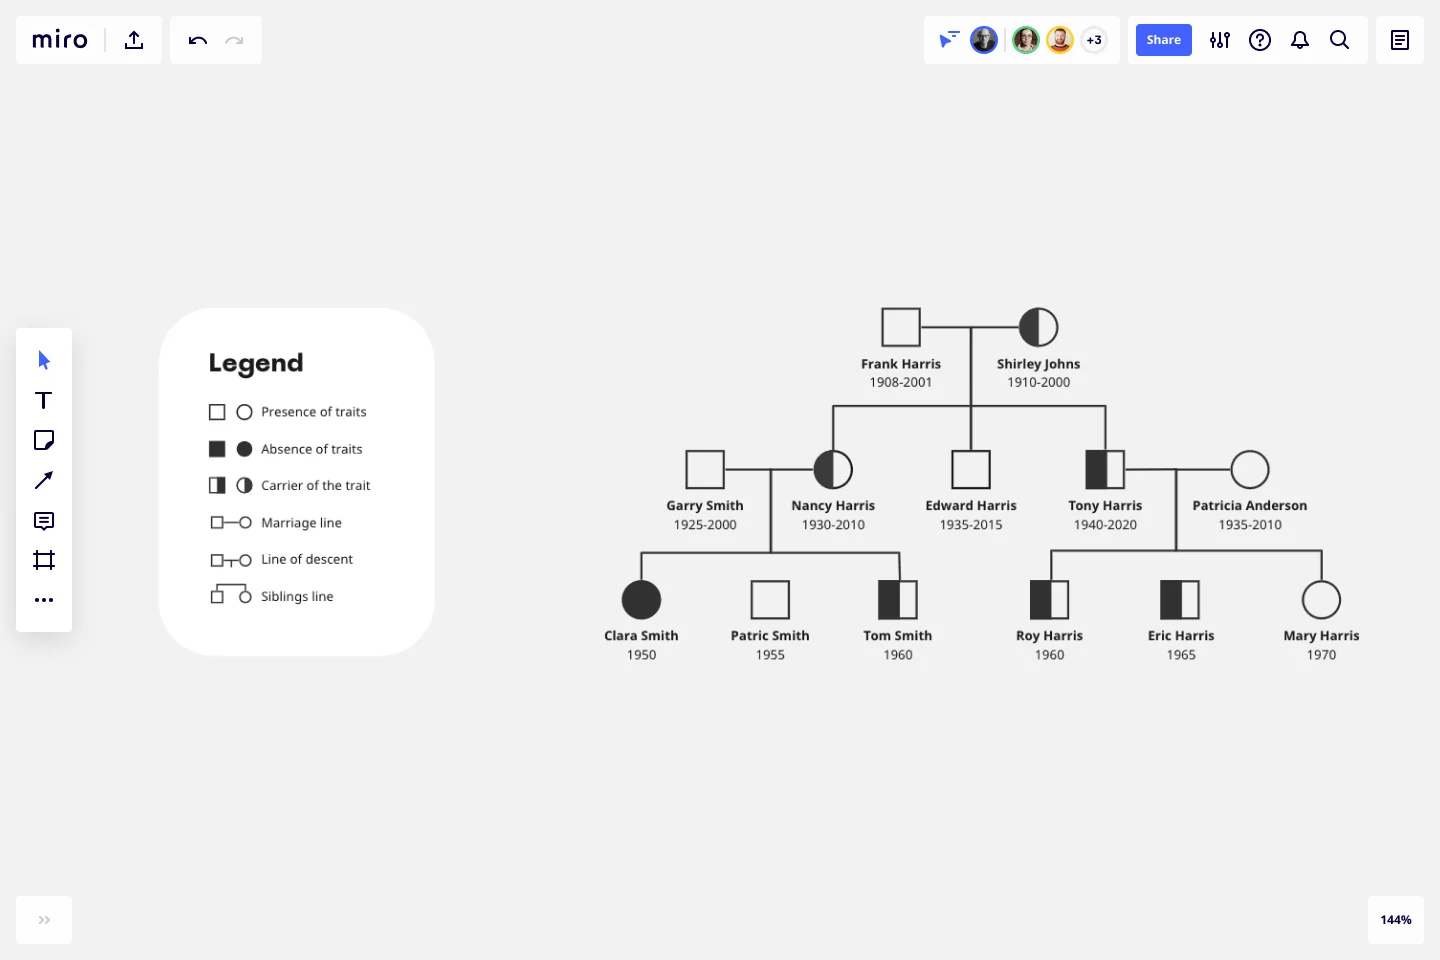
In a pedigree diagram, males are represented by squares; females by circles. Shaded symbols mean someone has a specific trait (e.g., dimples). Unshaded symbols mean an individual doesn’t have a specific trait.
Benefits of pedigree diagrams
Pedigree diagrams can help doctors identify and diagnose diseases.
For example, let’s say someone has a family history of heart disease. A pedigree diagram will tell us whether this individual is likely to have a heart condition. This can help doctors diagnose and treat patients faster, then provide better healthcare.
In science, pedigree diagrams can help understand how traits are inherited.
For example, dimples may pass from father to son in one family, and from mother to daughter in another. Blonde hair might pass from grandparents to grandchildren, but not from parents to children. Pedigree diagrams make patterns like these easy to identify.
Create your own pedigree diagram
Miro’s is the perfect starting point for a pedigree diagram. Get started by opening the template on this page and following the steps below.
Step 1:
Add individuals to your pedigree diagram. Go with as many as you can — or as many as are relevant. Place older generations at the top and younger ones below them.
Males are represented by squares. Females are represented by circles.
You can always use Miro to change symbols around later, so if you make a mistake, don’t worry. Just try to be as thorough as possible.
Step 2:
Connect individuals using lines of marriage and descent. A straight horizontal line represents the marriage between two individuals.
Descent is represented by diagonal and vertical lines that connect a couple from an older generation to a younger individual.
Step 3:
Add dates. This isn’t strictly necessary, but it can help keep track of individuals across generations.
Add dates of birth, death, and/or marriage lines to your pedigree diagram template.
Step 4:
Use symbols to show which family members have or don’t have a specific trait.
For example, let’s say your pedigree diagram shows widow’s peaks. Family members who don’t have a widow’s peak will be represented by unshaded symbols. Family members who do have a widow’s peak will be represented by a shaded symbol.
Once you’re ready to collaborate and receive feedback, use Miro to share your Pedigree diagrams. You may want to also create a family tree to share other details of your family.
Example of pedigree diagram
Let’s imagine the Smith family has a long history of diabetes. But, some members of the family develop the condition, while others don’t.
We can use a pedigree diagram to see the pattern of inheritance, i.e., how the disease is passed from parent to child.
This can help us predict whether a given Smith family member has diabetes or will develop it in the future.
How do you draw a Pedigree Diagram?
Open our Pedigree Diagram template. Map out a family tree using lines to show familial relationships. Once you’re done, identify individual genetic traits using Pedigree Diagram shapes and shading.
What do the symbols in a Pedigree Diagram mean?
A square represents a male; a circle indicates a female. Shaded shapes mean someone has a genetic trait. Unshaded shapes mean an individual doesn’t have a trait. A half-shaded shape means that someone carries a genetic trait without it being visible.
What is the purpose of a Pedigree Diagram?
A Pedigree Diagram is a family tree that shows how genes are passed from generation to generation. It can help us predict the likelihood of a child having a disease or trait, e.g., dimples or diabetes. It can also help us see how traits are passed from parents to children.
Is a circle male or female in Pedigree Diagrams?
In Pedigree Diagrams, a circle is always female. This is universal for all organisms, including trees and flowers. Males are represented by squares.
What do dark circles mean on a Pedigree Diagram?
A dark circle represents a female that has a visible genetic trait. For example, a woman who has her father’s blonde hair or her mother’s dimples might be represented by a dark circle.
Get started with this template right now.
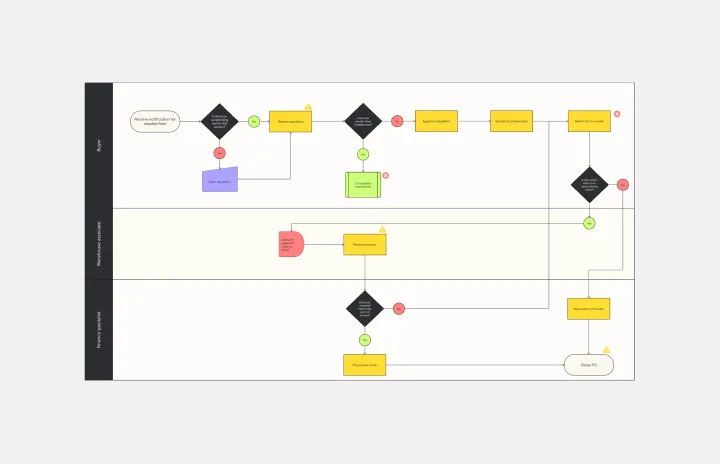
Current State vs. Future State Flowchart Template
Works best for:
Diagramming
The Current State vs Future State Flowchart Template is an essential tool for strategic planning, providing teams with a dynamic and visual roadmap for organizational transformation. One of its key benefits is streamlining collaboration by using swimlanes to allocate tasks to specific departments. This feature promotes accountability and transparent communication, ensuring everyone is aligned on their responsibilities. As a result, teams can navigate complex processes with ease, fostering a shared understanding of the current and future states, ultimately leading to efficient and collaborative decision-making.
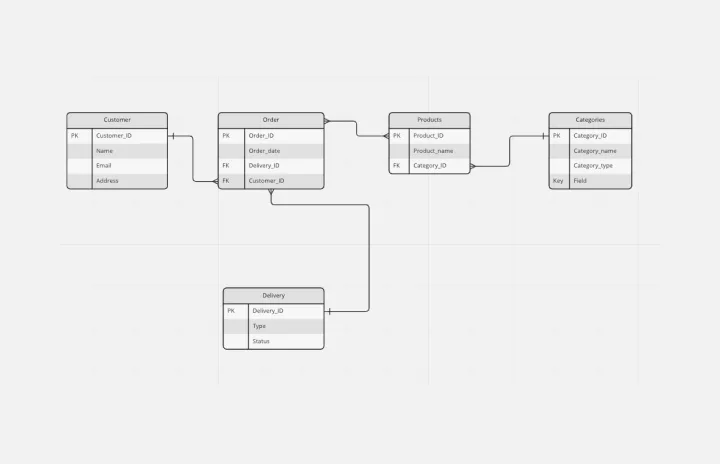
Entity Relationship Diagram Template
Works best for:
Flowcharts, Strategic Planning, Diagrams
Sometimes the most important relationships in business are the internal ones—between the teams, entities, and actors within a system. An entity relationship diagram (ERD) is a structural diagram that will help you visualize and understand the many complex connections between different roles. When will an ERD come in handy? It’s a great tool to have for educating and onboarding new employees or members of a team, and our template makes it so easy to customize according to your unique needs.
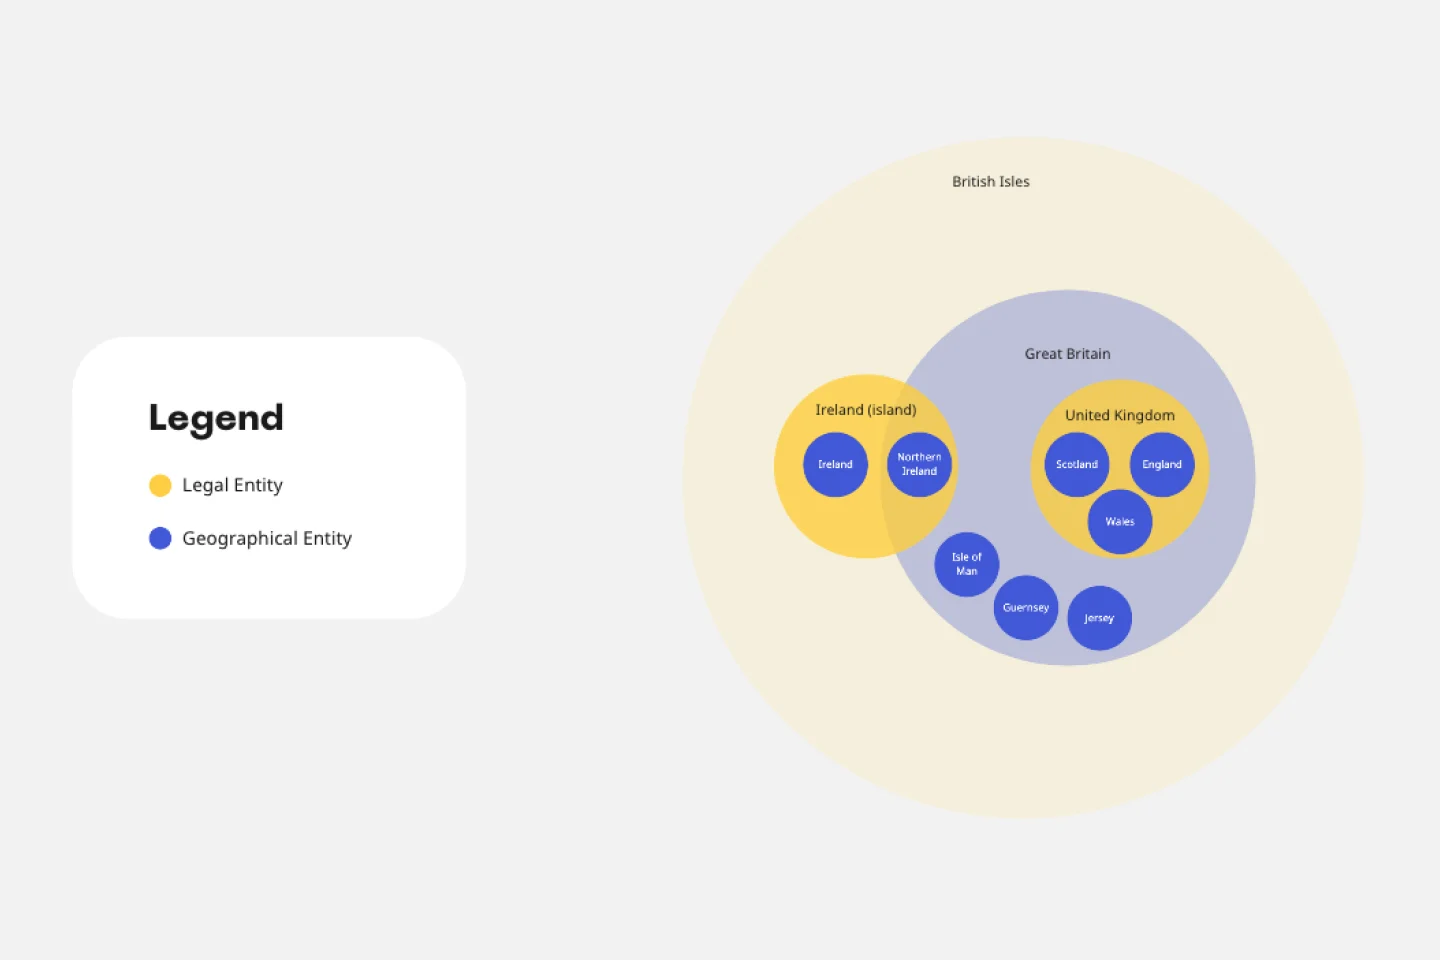
Euler Diagram Template
Works best for:
Business Management, Operations, Diagrams
Euler diagrams are valuable for showing different relationships between subjects by representing them with circles or "cells." Euler diagrams are frequently used in IT systems to show how objects relate to one another and how they interact. However, you can use them for any sort of explanation that needs to show connections.
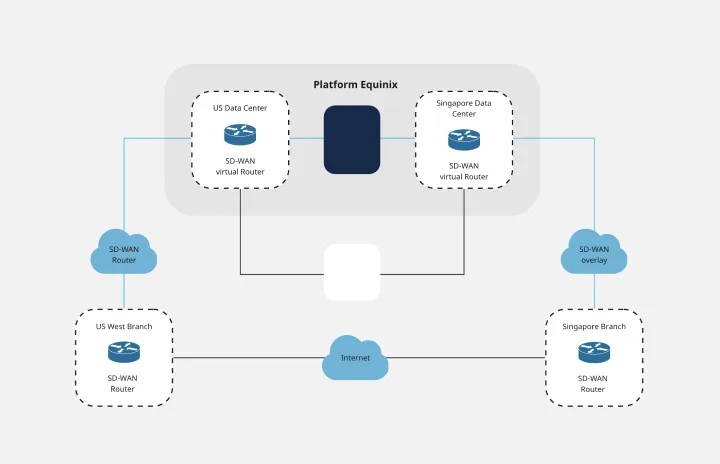
Cisco Data Network Diagram Template
Works best for:
Software Development, Diagrams
Cisco offers data center and access networking solutions built for scale with industry-leading automation, programmability, and real-time visibility. The Cisco Data Network Diagram uses Cisco elements to show the network design of Cisco Data Networks visually.
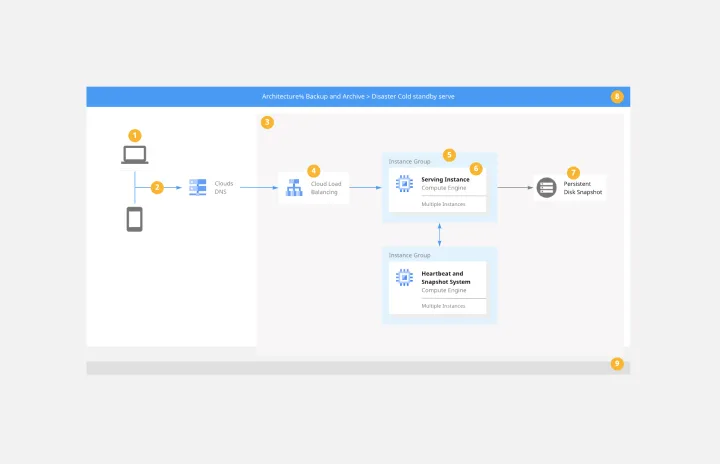
Google Cloud Architecture Diagram Template
Works best for:
Software Development, Diagrams
Use the Google Cloud Architecture Diagram template to clearly visualize the deployment of your application and allow you and your team to optimize processes. The GCP template gives you a great overview of your application architecture, and it helps you to iterate quickly and better manage your application development, deployment, and documentation. Try it out and see if it works for you.
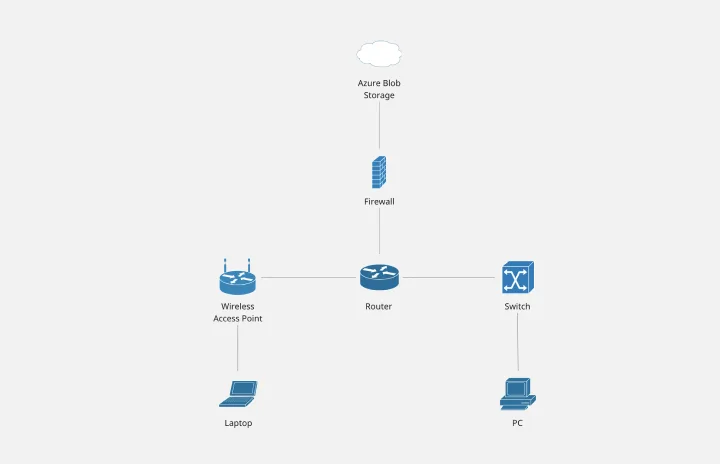
Cisco Network Diagram Template
Works best for:
Software Development, Diagrams
Cisco offers data center and access networking solutions built for scale with industry-leading automation, programmability, and real-time visibility. The Cisco Data Network Diagram uses Cisco elements to show the network design of Cisco Data Networks visually.