OODA Loop Template
Break down decisions systematically with the OODA Loop template.
Trusted by 65M+ users and leading companies


About the OODA Loop Template
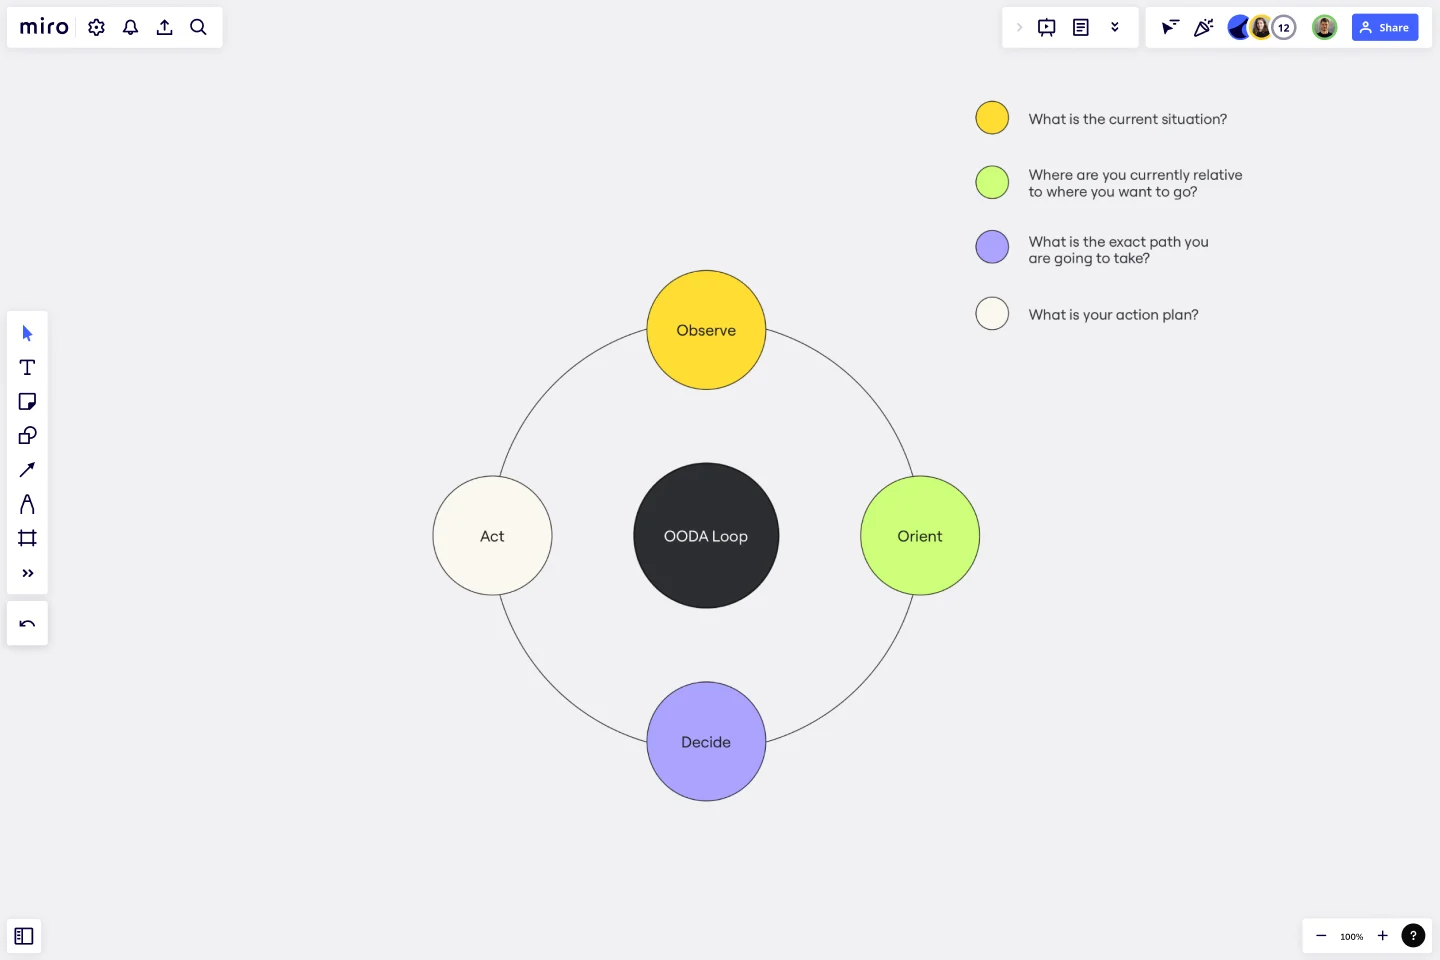
The OODA Loop template is a powerful tool to improve decision-making processes. It is inspired by the OODA Loop, a concept developed by military strategist Colonel John Boyd. The OODA Loop involves four steps that form a continuous cycle essential for quick and effective decision-making: Observe, Orient, Decide, and Act.
Let's take a closer look at each area:
Observe: Begin by gathering information and staying aware of your surroundings. This template section allows you to list key observations or data points.
Orient: Understand the context and analyze the information. In this area, you can outline the factors influencing your decision, including challenges, opportunities, and potential risks.
Decide: Make a well-informed decision based on your observations and orientation. The template provides space to document your chosen course of action and the rationale behind it.
Act: Execute your decision and implement the plan. This section helps you outline the steps to take and track progress.
How to use the OODA Loop template in Miro?
Edit with ease: Customize the template by clicking on any element to add text, shapes, or images that provide additional context.
Collaborate effortlessly: Invite team members to your board and collaborate in real time, ensuring everyone is on the same page throughout the decision-making process.
Why should you use an OODA Loop template?
Enhanced clarity: Visualizing the OODA Loop brings clarity to complex decision-making processes, making it easier to understand and communicate.
Faster decision-making: The structured approach of the OODA Loop template facilitates quicker decision-making by breaking down the process into manageable steps.
Improved collaboration: Collaborate seamlessly with team members using a shared visual representation of the decision-making cycle.
Strategic planning: The template aids in strategic planning by helping teams analyze and respond rapidly to changing situations.
Continuous improvement: Regularly revisiting and updating the OODA Loop Diagram fosters a culture of continuous improvement, ensuring your decision-making processes evolve with your team's needs.
Can I use the OODA Loop template for personal decision-making?
Absolutely! The template is versatile and can be adapted for personal decision-making, strategic planning, or any scenario where a systematic approach is beneficial.
How detailed should my observations be in the "Observe" section?
Provide enough detail to capture relevant information but focus on key observations to keep the process efficient. Adjust the level of detail based on the complexity of the decision.
Is the OODA Loop template suitable for small and large teams?
Yes, the template is scalable and can be effectively used by teams of any size. It promotes collaboration and aligns teams towards a shared decision-making process.
Can I export the OODA Loop Diagram to other formats for presentations or documentation?
Miro allows you to export your boards in various formats, making incorporating your OODA Loop into presentations, reports, or documentation easy.
Get started with this template right now.
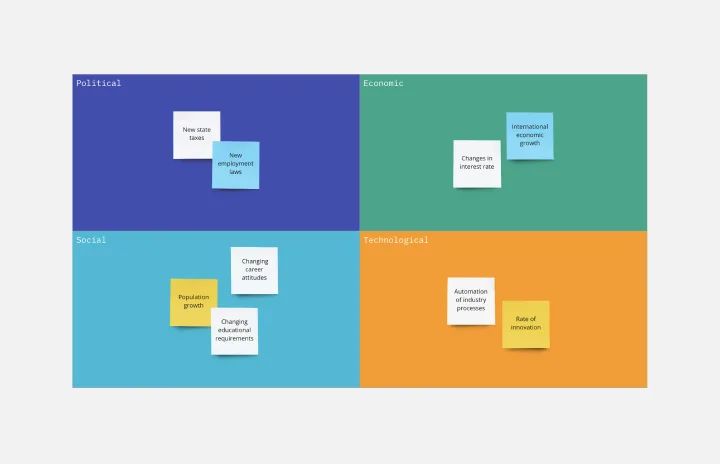
PEST Analysis Template
Works best for:
Ideation, Strategic Planning, Business Management
No business operates inside a vacuum, so if you want to succeed, you have to successfully deal with local laws, government regulating bodies, the health of the local economy, social factors like the unemployment rate, average household income, and more. Use the PEST Analysis Template to help you explore how the world impacts your business and how you can work around it.
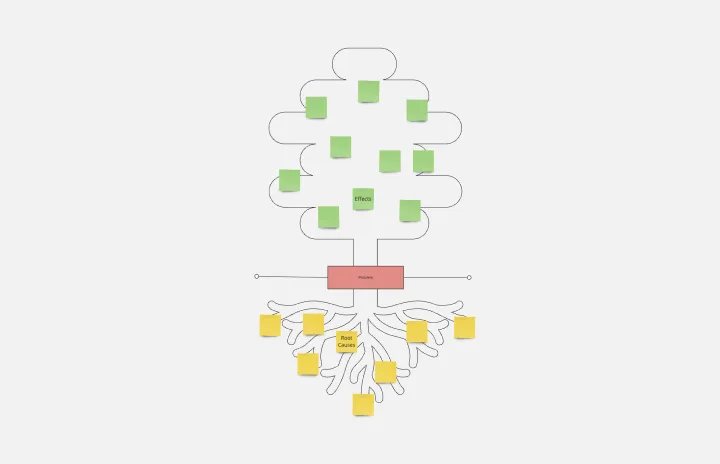
Problem Tree Template
Works best for:
Strategy & Planning
The Problem Tree Template is a visual tool crafted to examine a primary issue, its consequential effects, and its foundational causes. Picture it: The tree's trunk embodies the central dilemma, its branches display the direct ramifications, and the roots delve into the underlying reasons. By organizing a challenge in such an illustrative manner, users can comprehensively grasp their situation.
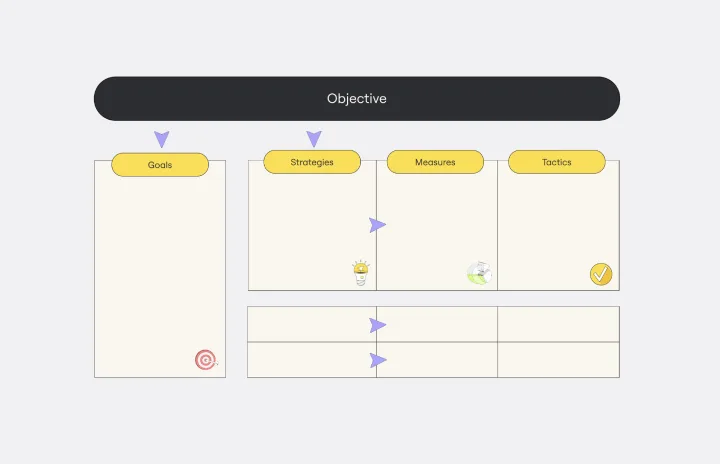
OGSM Template
Works best for:
Strategy, Planning
The OGSM template provides a readable framework, systematically breaking down business strategies into Objectives, Goals, Strategies, and Measures. This structured approach ensures that overarching visions are translated into actionable plans, fostering alignment across different teams and initiatives. One standout benefit of using this template is its ability to offer clarity. By clearly delineating between broad objectives and specific measures, stakeholders can easily comprehend and stay focused on the most critical elements of a strategy, ensuring that all efforts are directed toward the desired outcomes.
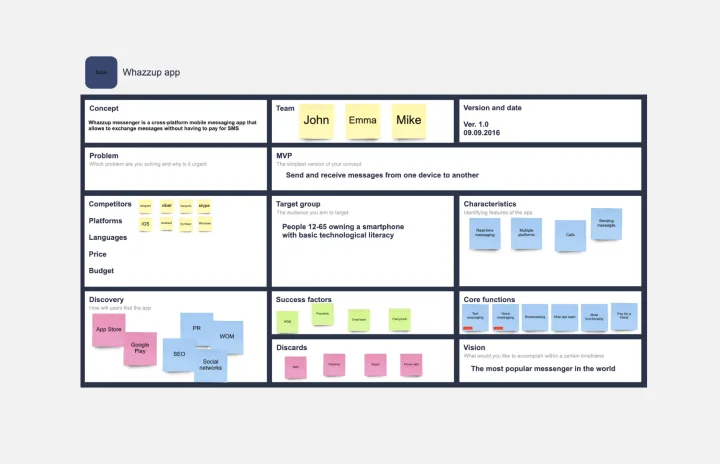
App Development Canvas Template
Works best for:
Market Research, Product Management, User Experience
Ever noticed that building a successful app requires lots of players and moving parts? If you’re a project manager, you definitely have. Lucky for you, an app development canvas will let you own and optimize the entire process. It features 18 boxes, each one focusing on a key aspect of app development, giving you a big-picture view. That way you can fine-tune processes and get ahead of potential problems along the way—resulting in a smoother path and a better, tighter product.

Fit Gap Analysis Template
Works best for:
Strategy, Planning, Management
The Fit Gap Analysis Template is a strategic tool designed to help teams and organizations identify discrepancies between their current state and desired outcomes. By visualizing these gaps, it offers a clear roadmap for improvement, allowing for a focused alignment of resources. One significant benefit of using this template is enhanced clarity; teams can visually discern where they currently stand and plot a precise path toward their goals, ensuring efficient decision-making and effective resource allocation.
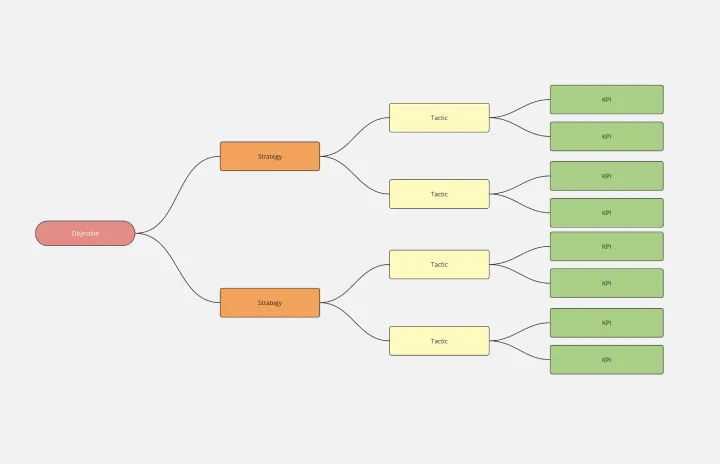
KPI Tree Template
Works best for:
Strategy & Planning
The KPI Tree Diagram is a visual tool that hierarchically illustrates an organization's objectives and breaks them down into their subsequent strategies, tactics, and measurable KPIs. By arranging these components in a tree-like structure, the diagram captures the interrelationships and dependencies between the overarching goals and the specific steps to achieve them.