Onion Diagram Template
Discover the power and precision of the Onion Diagram Template. Visualize the components of a specific concept, system, or process and clarify their hierarchy and importance.
Trusted by 65M+ users and leading companies


About the Onion Diagram Template
At Miro, we always look for innovative ways to visually represent complex ideas, making collaboration more intuitive and productive. Our Onion Diagram Template is yet another tool in our suite designed to help you streamline your processes and achieve clarity in your projects.
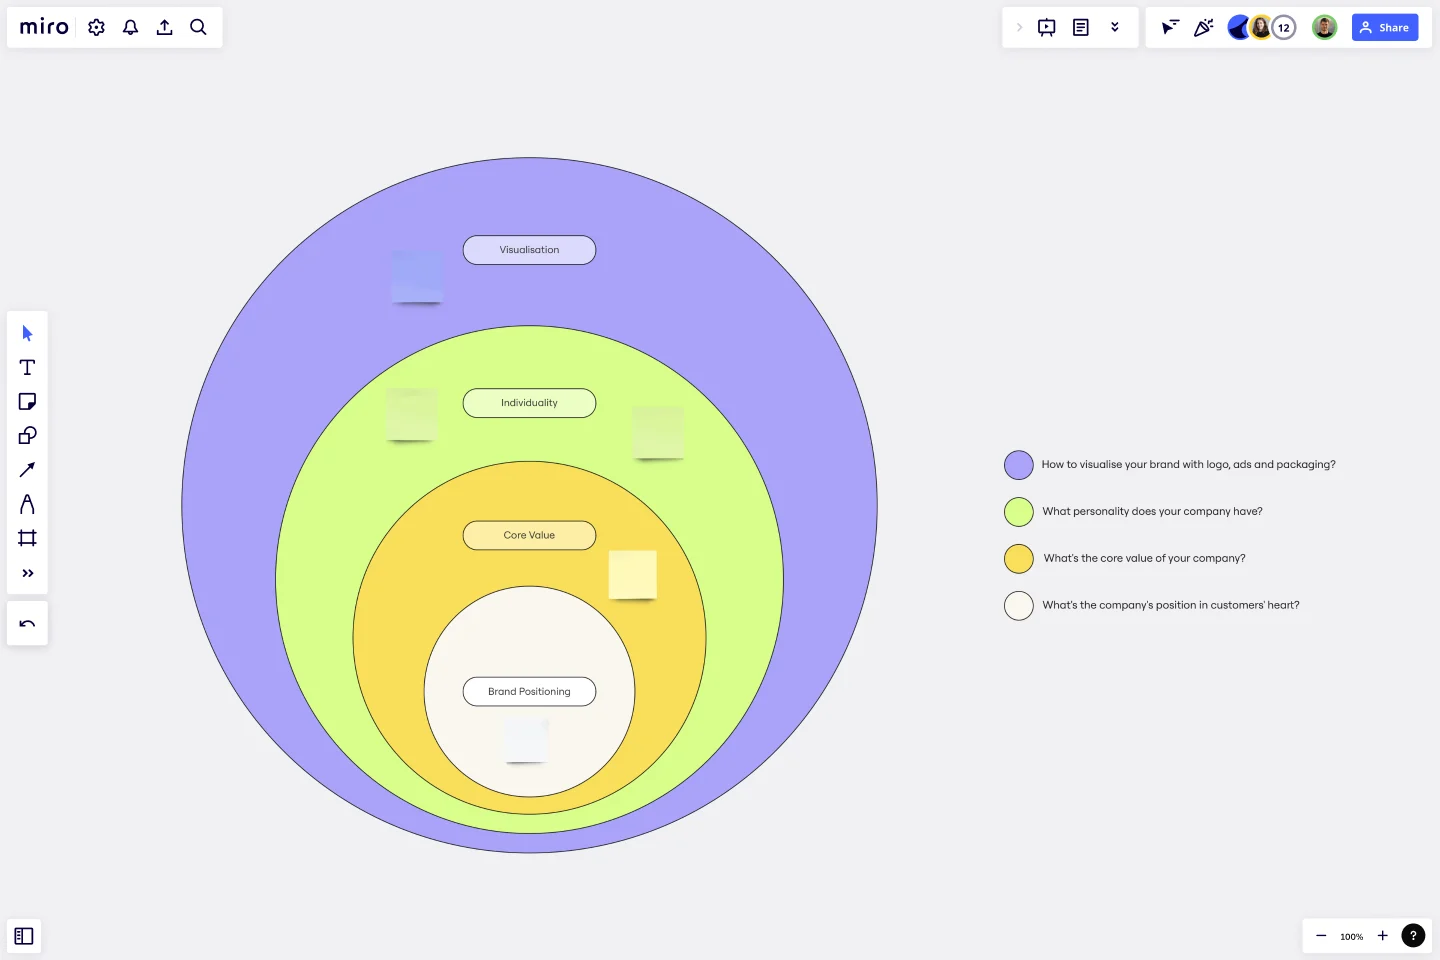
What's an Onion Diagram Template?
An onion diagram is a type of diagram that showcases layers of a concept, system, or process, much like the layers of an actual onion. Each layer of the diagram represents a different aspect or phase, starting from the innermost core and moving outwards to the outer layers. This structure allows viewers to understand relationships, hierarchies, or sequences in a visual, layered format.
What are the benefits of using an Onion Diagram Template?
Hierarchical visualization: Clearly see the priority or sequence of different elements in a process or system.
Easy analysis: Quickly identify bottlenecks, dependencies, or relationships between layers.
Universal usage: Suitable for various industries, including IT, business analysis, and education.
Enhanced collaboration: Team members can collectively analyze and change diagrams in real time.
How to use an Onion Diagram Template in Miro?
Using the Onion Diagram Template in Miro is straightforward:
Select the template: Go to Miro's Template Library and select the Onion Diagram Template.
Explore automated diagramming: Miro has automated diagramming features. Use our ready-made template and edit data as you see fit, or create an onion diagram from scratch using our shapes library. As you create your diagram, it can auto-adjust, making it easier to visualize complex layers.
Customize your diagram: Drag and drop elements, change colors, or add sticky notes to suit your specific needs.
Save and share: Once your onion diagram is complete, share the board link with team members for collaborative viewing and editing.
How many layers can I add to my onion diagram?
There's no strict limit to the number of layers. However, for clarity and usability, it's best to limit the layers to a number that's easily digestible for viewers.
Can I use the Onion Diagram Template on mobile devices?
Yes, Miro's platform is optimized for both desktop and mobile use, ensuring seamless collaboration regardless of the device.
Are there preset color schemes available for the onion diagram?
Yes, Miro provides a range of color palettes. You can also customize colors to align with your branding or preference.
Get started with this template right now.
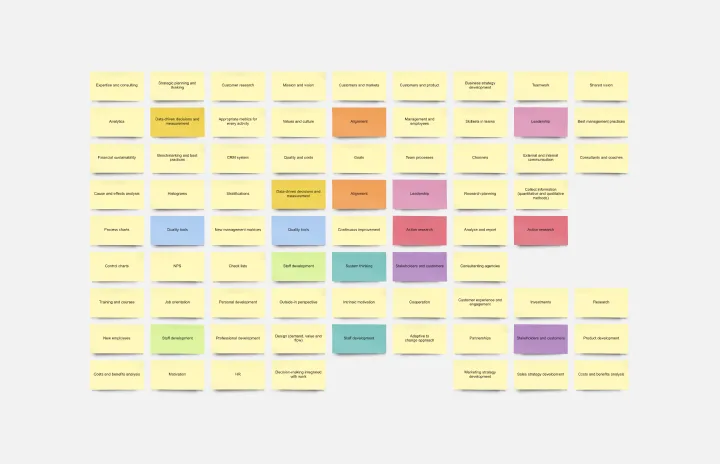
Stakeholder Mapping Template
Works best for:
Business Management, Mapping, Workflows
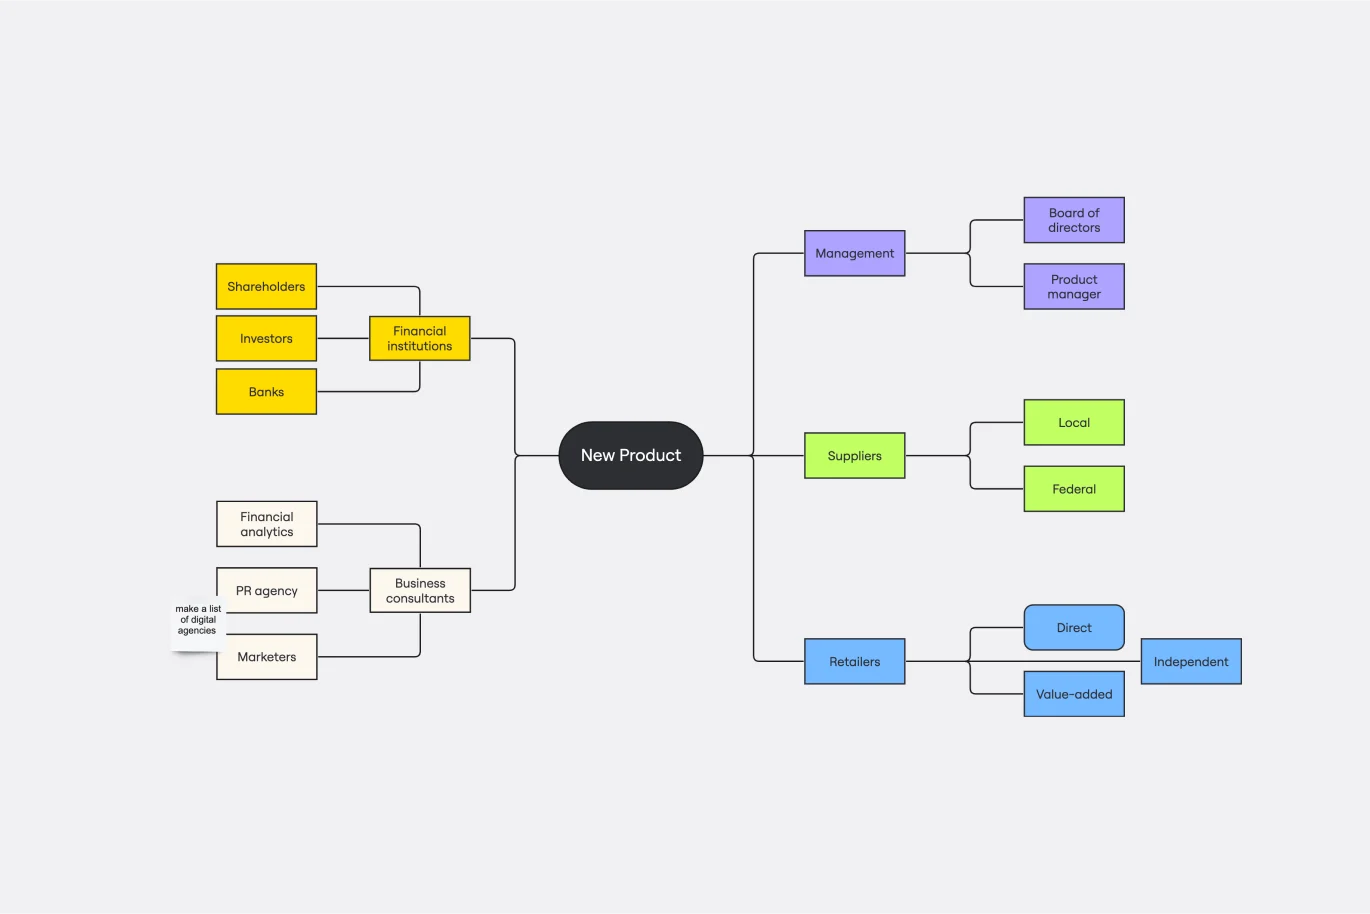
A stakeholder map is a type of analysis that allows you to group people by their power and interest. Use this template to organize all of the people who have an interest in your product, project, or idea in a single visual space. This allows you to easily see who can influence your project, and how each person is related to the other. Widely used in project management, stakeholder mapping is typically performed at the beginning of a project. Doing stakeholder mapping early on will help prevent miscommunication, ensure all groups are aligned on the objectives and set expectations about outcomes and results.
Cisco Data Network Diagram Template
Works best for:
Software Development, Diagrams
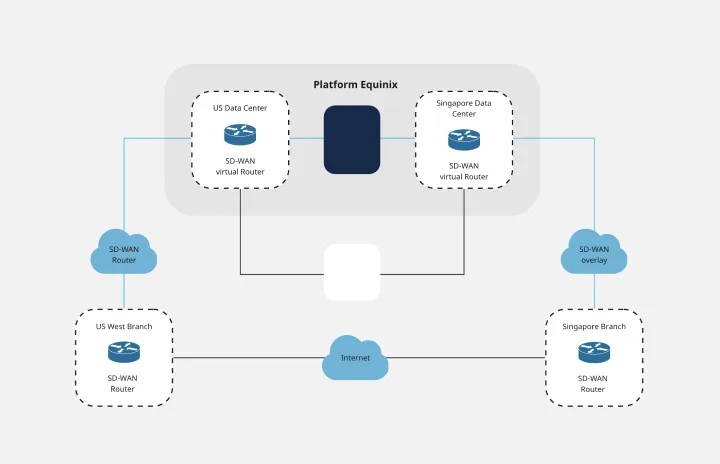
Cisco offers data center and access networking solutions built for scale with industry-leading automation, programmability, and real-time visibility. The Cisco Data Network Diagram uses Cisco elements to show the network design of Cisco Data Networks visually.

Stage-Gate Process Flowchart Template
Works best for:
Diagramming, Project Management
The Stage-Gate Process Flowchart Template structures a project into distinct stages separated by decision-making gates, enhancing the quality of decisions and leading to more successful project outcomes.
Google Cloud Architecture Diagram Template
Works best for:
Software Development, Diagrams
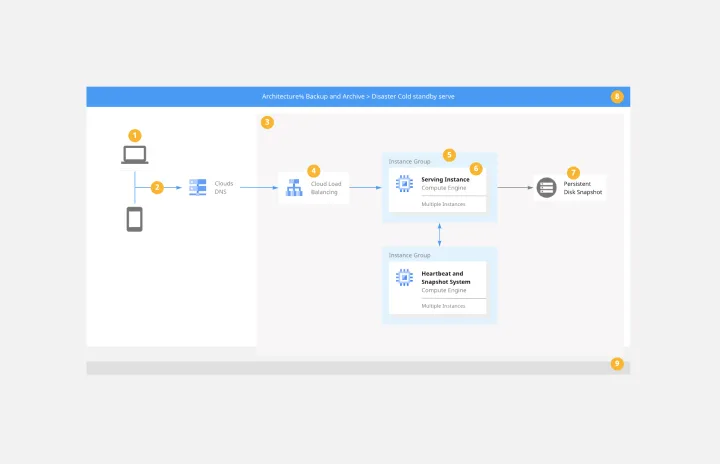
Use the Google Cloud Architecture Diagram template to clearly visualize the deployment of your application and allow you and your team to optimize processes. The GCP template gives you a great overview of your application architecture, and it helps you to iterate quickly and better manage your application development, deployment, and documentation. Try it out and see if it works for you.
Lotus Diagram Template
Works best for:
UX Design, Ideation, Diagrams
Even creative thinkers occasionally need help getting their creative juices flowing. That's where a lotus diagram comes in. It'll empower you to run smoother, more effective brainstorming sessions. This creative-thinking technique explores ideas by putting the main idea at the diagram center and ancillary concepts in the surrounding boxes. This template gives you an easy way to create Lotus Diagrams for brainstorms, as well as an infinite canvas for the endless ideas generated.
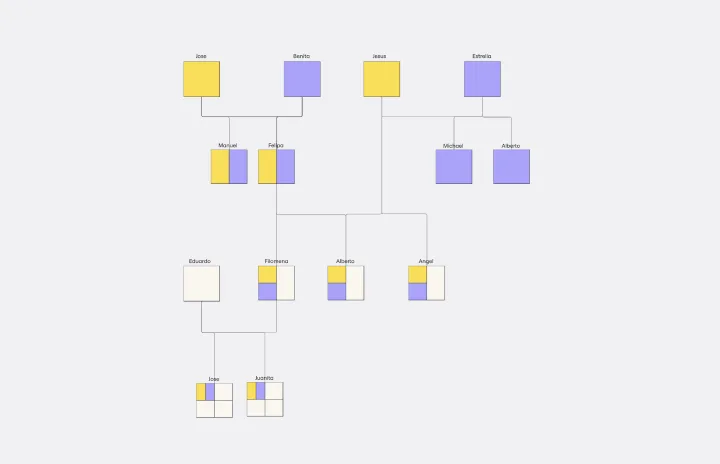
Genogram Template
Works best for:
Diagramming
The Genogram Template maps out family structures and relationships with exceptional depth and detail. Unlike traditional family trees, this template provides a comprehensive perspective by encapsulating familial connections, emotional ties, and significant life events. Create a genogram to unearth patterns and trends within a family, whether hereditary or environmental. Professionals across different domains can gain a holistic understanding of familial dynamics by showing deep insights into the nuances of relationships, facilitating better communication and problem-solving.