Login Sequence Diagram Template
Visualize complex login processes, ensuring effective team collaboration and clear documentation with the login sequence diagram template.
Trusted by 65M+ users and leading companies


About the Login Sequence Diagram Template
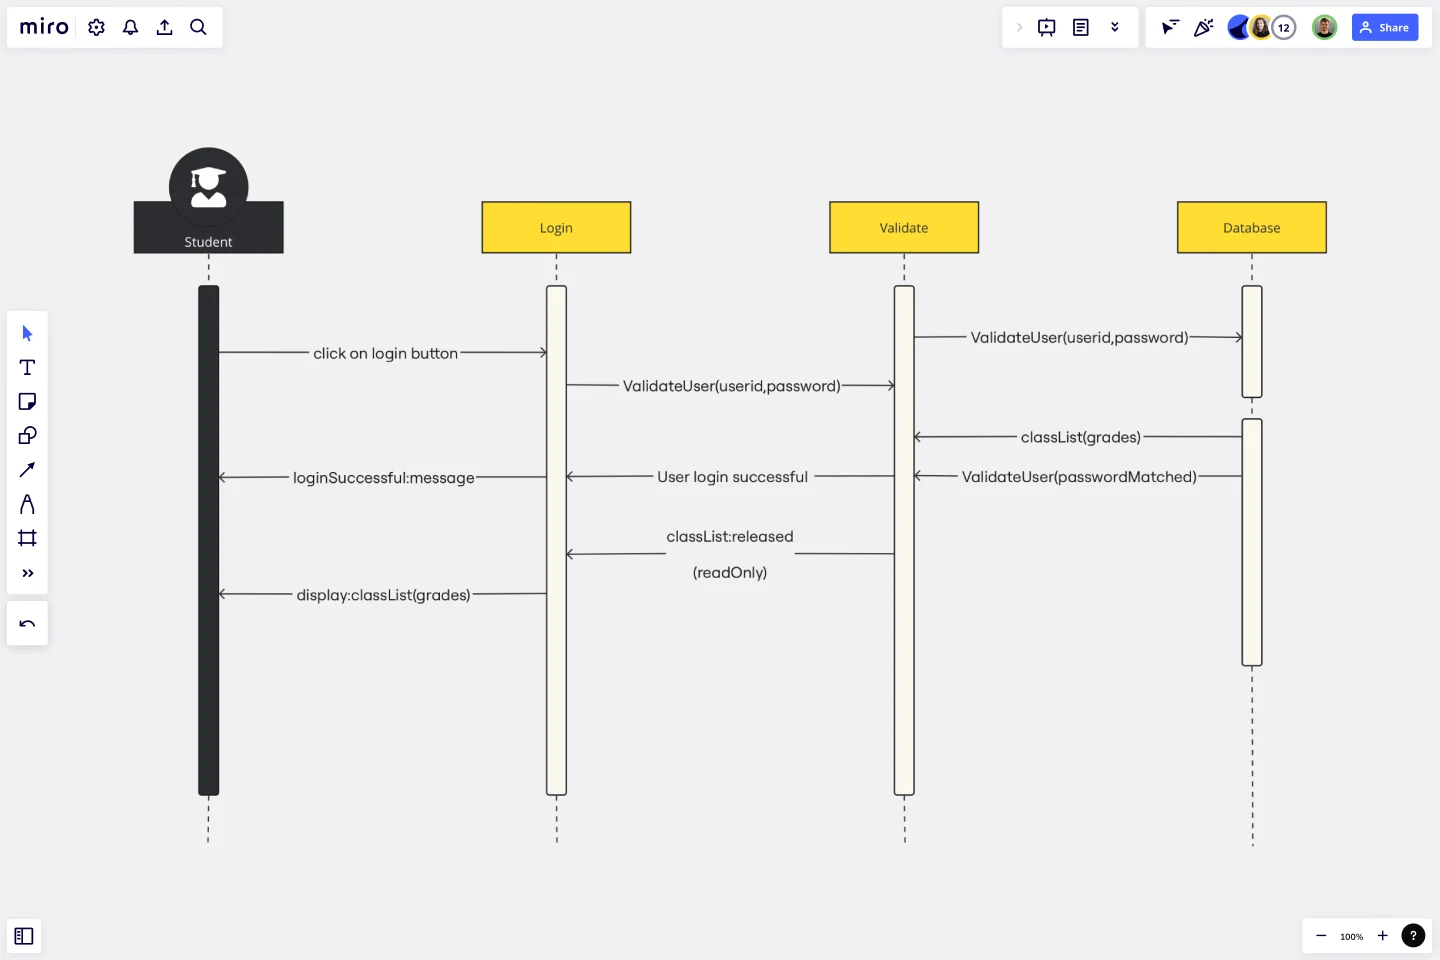
Understanding the user authentication process is crucial for any team optimizing their authentication protocols. That's where the login sequence diagram template comes into play. Sequence diagrams present a clear and dynamic view of how systems and users interact during the login sequence, making it an invaluable resource for planning and troubleshooting authentication protocols.
The login sequence diagram template defines each component involved in the login process, including the user, the user interface, and backend services. It aims to guide the representation of interactions that occur over time during the login process, allowing users to easily trace how and when these components interact, from the initial login request to the final authentication outcome. This framework streamlines capturing these exchanges, making it easier to adapt to specific login sequence nuances and optimize their authentication process.
How to use the login sequence diagram template in Miro
Using the template is a straightforward process:
Customize the components: Click on each element to edit text, allowing the naming of actions and actors to reflect your specific login process. If you want to create the login sequence diagram directly from code, access the PlantUML app.
Incorporate additional artifacts: Drag and drop any related artifacts onto the board to provide context. Whether it's additional notes, images, or documents, these can be easily integrated within the vicinity of your sequence diagram for comprehensive understanding.
Why should you use a login sequence diagram template?
The use of a login process template offers several benefits to a team during software development:
Clear communication: A login process template provides teams with a clear visual representation of complex processes, making communication easier.
Early error identification: Using a template, potential errors in the login sequence can be easily identified and rectified early on in the development cycle.
Efficient collaboration: Team members can collaborate in real-time using the template, reducing misunderstandings and accelerating consensus.
Scalability: The template can be effortlessly extended to accommodate additional scenarios or more detailed sequences as projects expand.
Integration with documentation: The login process template can be incorporated into technical documentation, ensuring consistency across project artifacts and serving as an excellent reference point.
Miro also has a sequence diagram template that you can use for other types of sequence diagrams. If you'd prefer to create one from scratch, Miro's diagramming capabilities and UML shape packs make it the perfect sequence diagram tool no matter your needs.
Can the login sequence diagram template handle multiple authentication scenarios?
Absolutely. The template is designed to be versatile and can be customized to represent a variety of authentication mechanisms, including multi-factor authentication.
Is technical expertise required to change the template?
No, the template is user-friendly, and modifications can be made with just a few clicks. It is intuitive enough for people across different expertise levels to use effectively.
How does the template facilitate better understanding among non-technical stakeholders?
By visualizing the login process, the template makes the sequence and its components easily understandable, allowing non-technical stakeholders to grasp complex interactions without needing to understand the underlying code.
Are the changes made to the template in real-time?
Yes, any alterations or additions to the template are updated in real time, allowing for immediate feedback and collaborative editing.
Get started with this template right now.
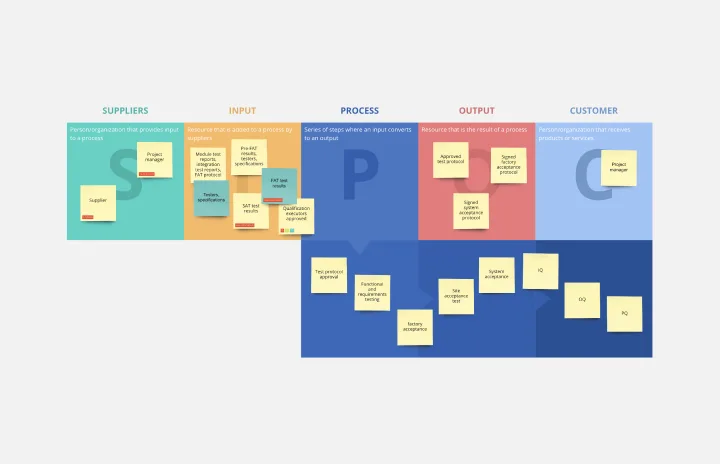
SIPOC Template
Works best for:
Agile Methodology, Strategic Planning, Mapping
A SIPOC diagram maps a process at a high level by identifying the potential gaps between suppliers and input specifications and between customers and output specifications. SIPOC identifies feedback and feed-forward loops between customers, suppliers, and the processes and jump-starts the team to think in terms of cause and effect.
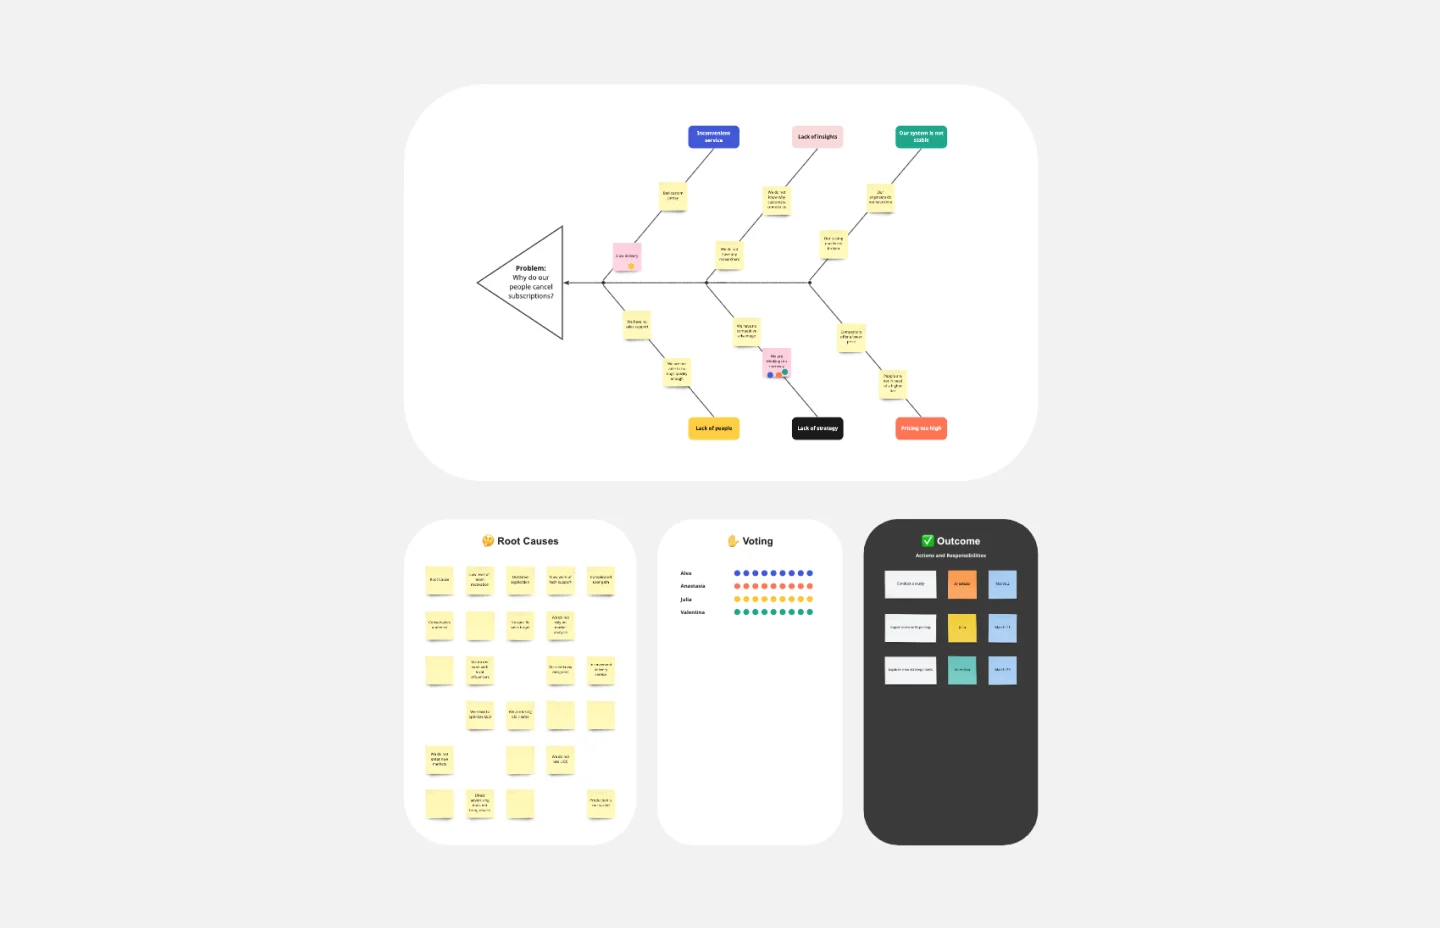
Fishbone Diagram Template
Works best for:
Operations, Diagrams, Workflows
What is the best way to solve any problem your team faces? Go straight to the root. That means identifying the root causes of the problem, and fishbone diagrams are designed to help you do it best. Also known as the Ishikawa Diagram (named after Japanese quality control expert Kaoru Ishikawa), fishbone diagrams allow teams to visualize all possible causes of a problem, to explore and understand how they fit together holistically. Teams can also use fishbone diagrams as a starting point for thinking about what the root cause of a future problem might be.
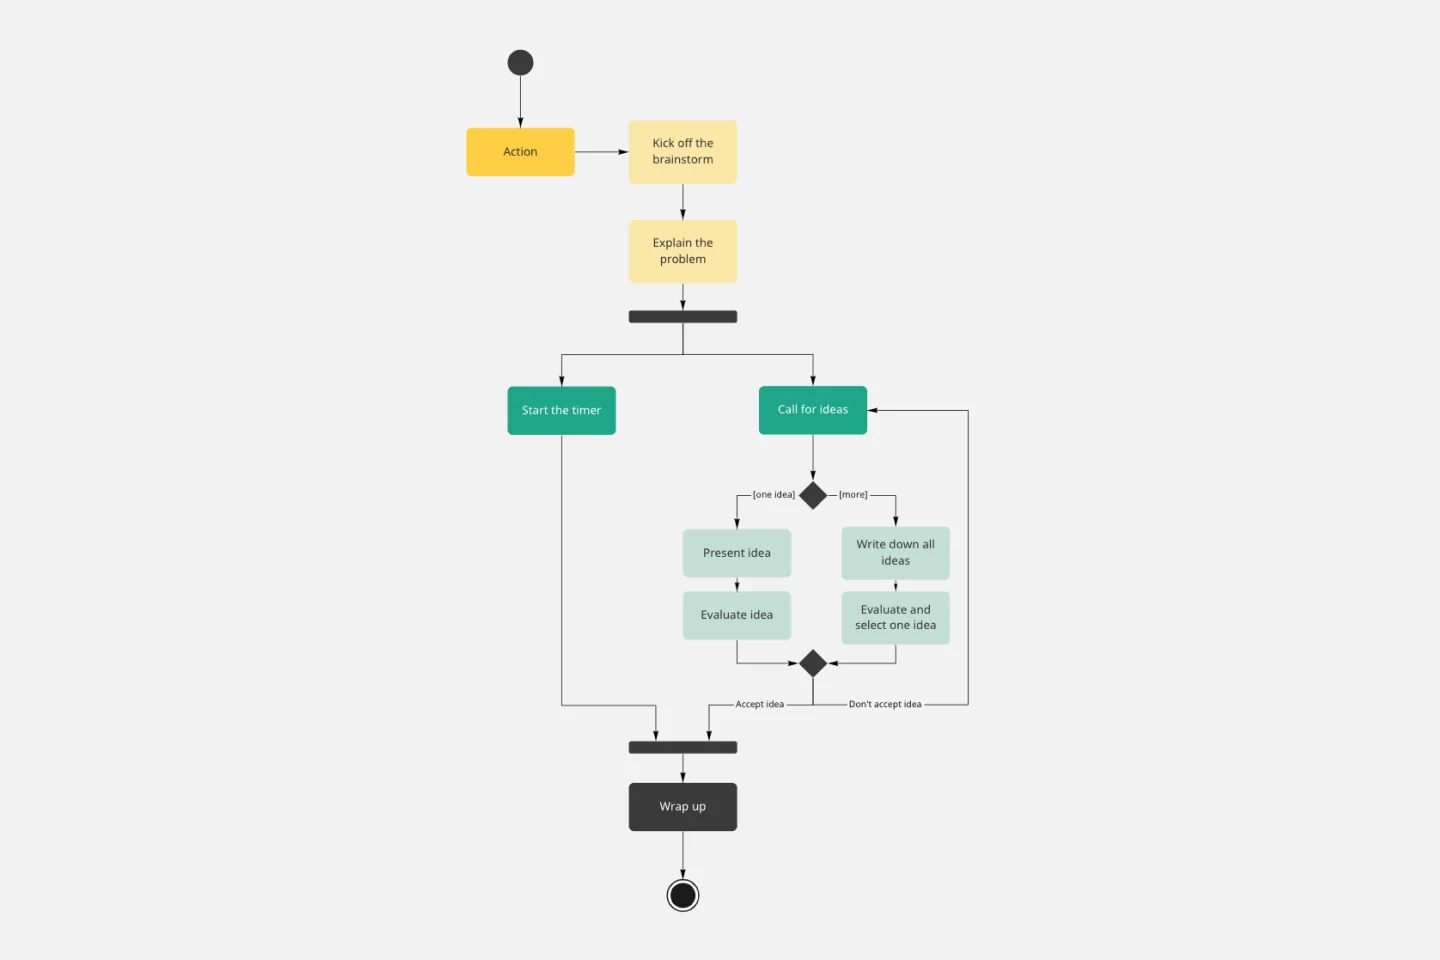
UML Activity Diagram Template
Works best for:
Diagrams
Use our Activity Diagram template to break down activities into smaller decisions and subprocesses. Improve and optimize systems and processes in I.T., business management, and more.
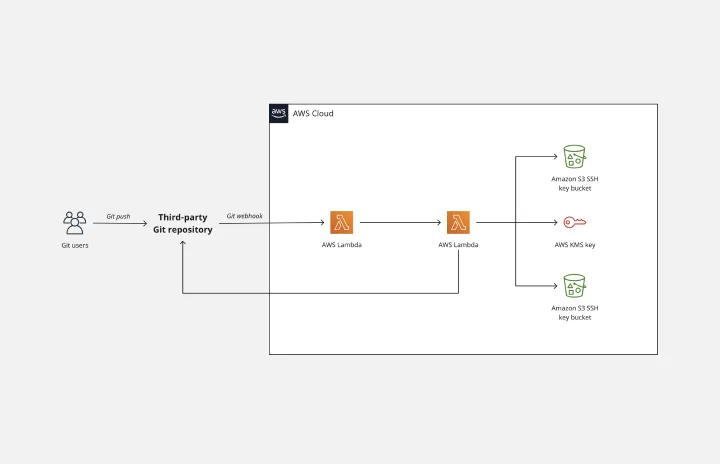
AWS Git to S3 Webhooks Template
Works best for:
Software Development, Diagrams
The AWS Git to S3 Webhooks Template is a visual representation of Git webhooks with AWS services Quick Start architecture. You can now have an overview of your AWS architecture with Miro’s AWS Git to S3 Webhooks Template, track your cloud solutions easily, and optimize processes like never before.
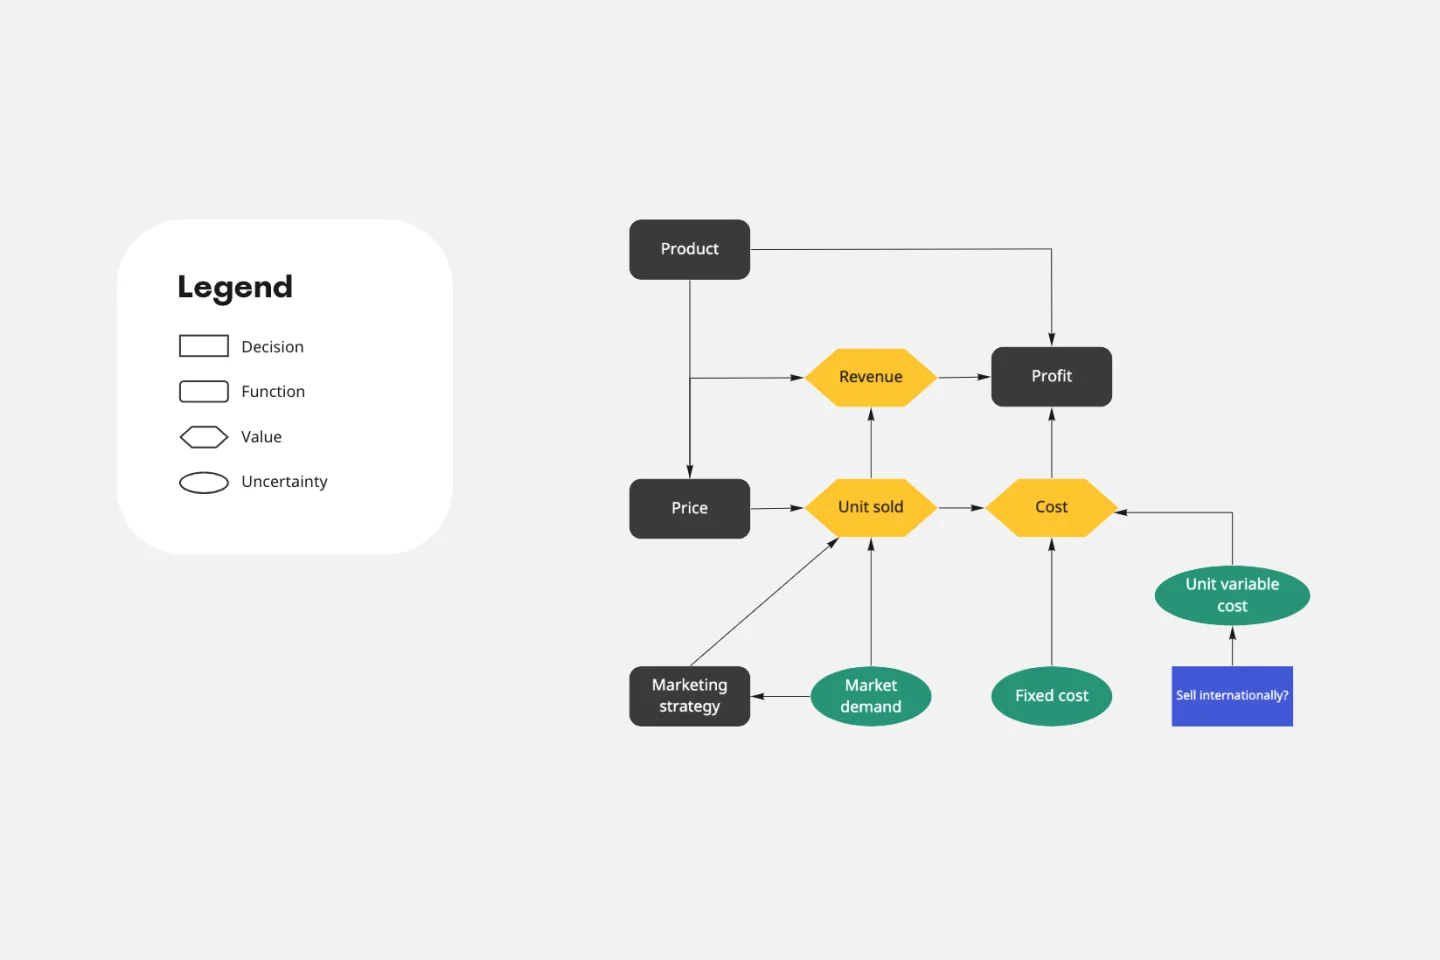
Influence Diagram Template
Works best for:
Business Management, Decision Making, Diagrams
See the big picture of any business decision with this Influence Diagram Template. You’ll define the decision you have to make and brainstorm everything that could impact it. When you build connections between these factors, you’ll be able to put the right amount of weight into each one as you make your decision.
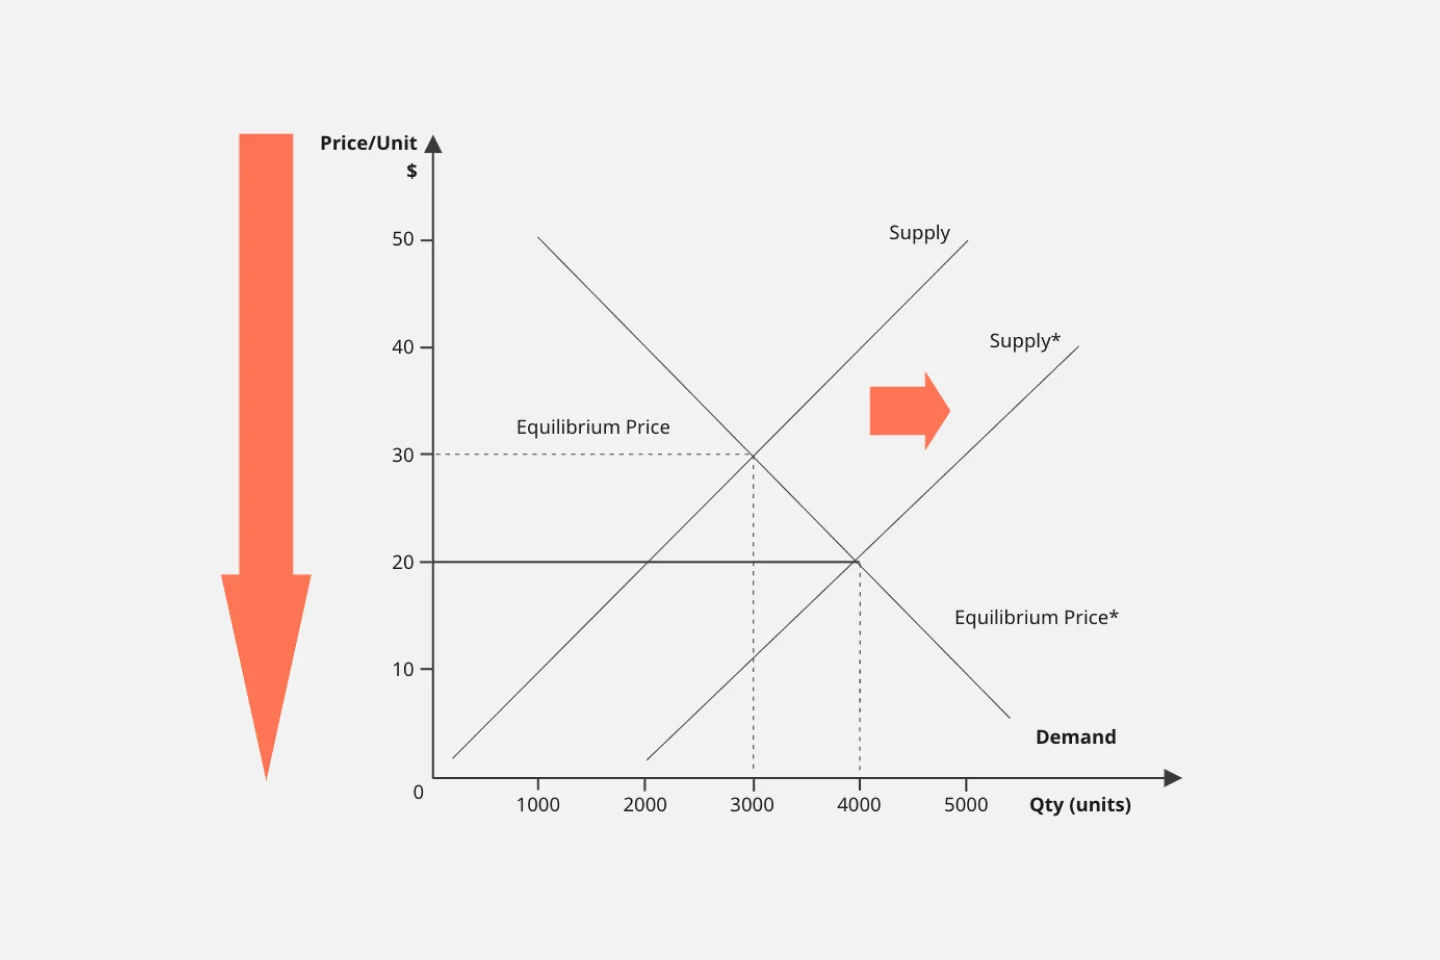
Supply and Demand Graph Template
Works best for:
Market Research, Mapping, Diagrams
How do you price your product so that you make a profit while keeping customers and manufacturers happy? By finding a fair price. A supply and demand diagram is a graph that visualizes how much demand there is for your product and how many products you need. This, in turn, helps you with product pricing.