
Logic Model Template
Outline your program’s activities and outputs with the logic model template. Map out the project lifecycle and bring alignment to teams.
Trusted by 65M+ users and leading companies


About the Logic Model Template
This logic model template offers an illustrative approach to program planning, evaluation, and management. The template visually represents the connection between resources, activities, and desired outcomes, ensuring a clear roadmap for your project or initiative.
Businesses, nonprofits, and educators can use the logic model template to visually depict the relationship between program inputs, activities, outputs, and outcomes. It illustrates how the invested resources will be transformed into the anticipated results through interconnected steps.
Step-by-step guide to using the logic model template
Setting up the logic model template to fit your project or business is easy. Start by opening the template onto a Miro board, then follow this guide to customize it to your needs.
Edit the template: Click on any element within the template to quickly edit or change it. You can change text, colors, or reposition sections as needed.
Expand with automated diagramming: If you need to add more sections or components, use Miro’s automated diagramming feature by clicking on shapes and connector lines. This lets you seamlessly expand and edit the existing structure of the template.
Add artifacts: To make your logic model more comprehensive, drag and drop any documents, images, links, or other artifacts onto the board.
Collaborate in real-time: Invite team members to join the board. They can provide instant input, comments, or feedback, ensuring a collaborative approach.
Share and collect feedback: Once your logic model is complete, you can share the board with stakeholders or team members for further review or implementation.
Why use a logic model template?
Clear visualization: The template provides a visual map, enabling stakeholders to quickly understand the entire project lifecycle and its components.
Improved resource allocation: Clearly defining inputs and anticipated outcomes ensures resources are used efficiently and directed toward activities that genuinely matter.
Alignment with goals: The template ensures all activities align with the overarching project or program goals, minimizing deviations or distractions.
Facilitates evaluation: With the logic model, it's easier to monitor and evaluate a program's effectiveness, pinpointing improvement areas.
Stakeholder communication: The template acts as a shared language, making communicating complex ideas or plans to different stakeholders simpler.
If you'd prefer to start from scratch, Miro's flowchart maker is the perfect tool to diagram a logic model. You can add shapes and connector lines with just one click.
Can I customize the logic model template?
The template is designed to be flexible, allowing you to tailor it according to your specific needs and preferences.
Can multiple team members collaborate on the template in real time?
The template supports real-time collaboration, ensuring all stakeholders can provide input and feedback instantly.
What kind of projects or initiatives is the logic model template best suited for?
The template is versatile and can be used for various projects, from educational initiatives and nonprofit programs to business projects and strategic planning.
Do I need any special skills to use the logic model template?
Not at all! The template is user-friendly, and even if you're new to such tools, you'll find it intuitive and easy to navigate.
Get started with this template right now.
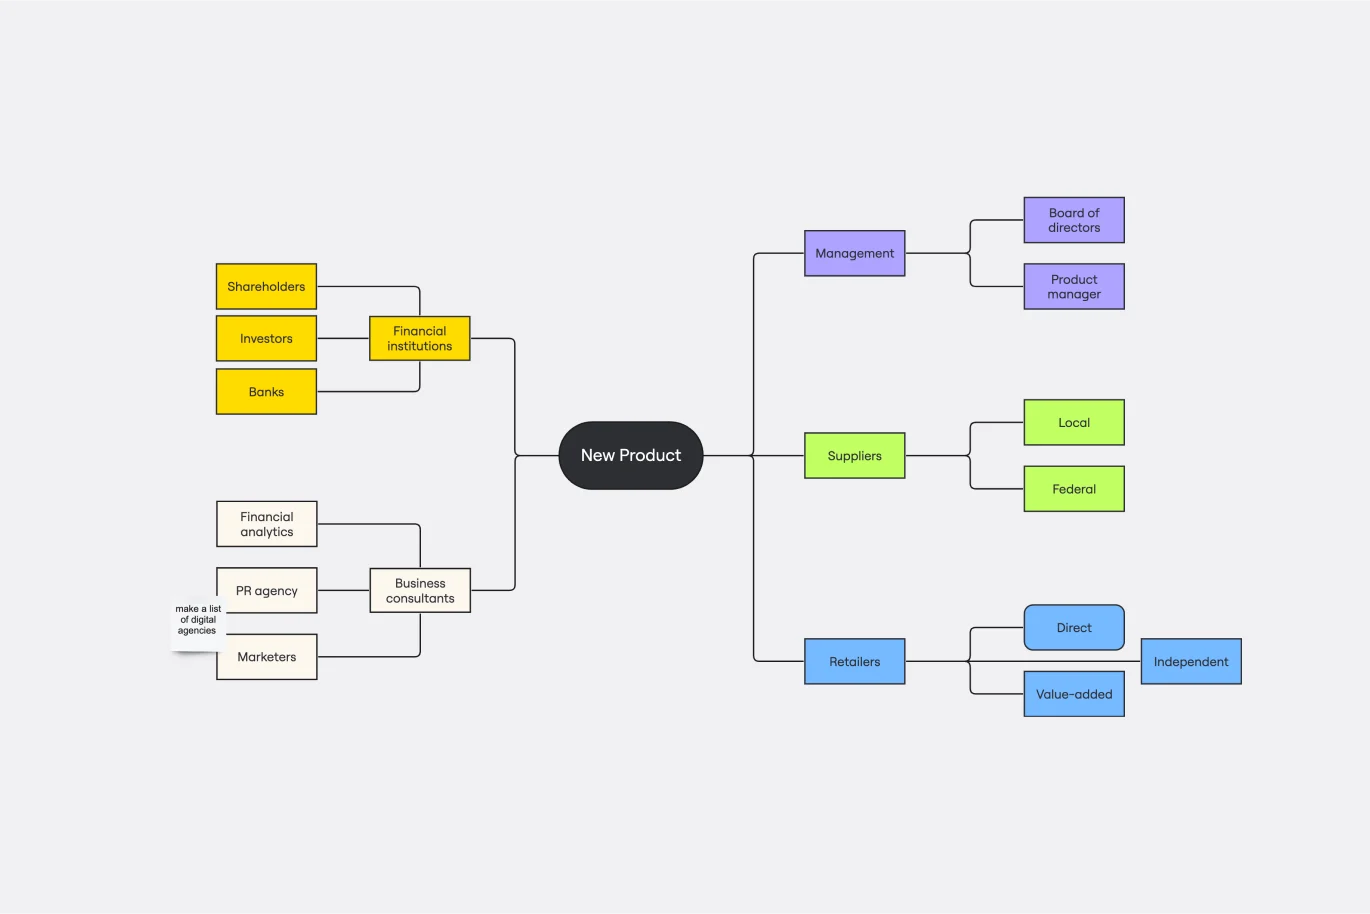
Stakeholder Mapping Template
Works best for:
Business Management, Mapping, Workflows
A stakeholder map is a type of analysis that allows you to group people by their power and interest. Use this template to organize all of the people who have an interest in your product, project, or idea in a single visual space. This allows you to easily see who can influence your project, and how each person is related to the other. Widely used in project management, stakeholder mapping is typically performed at the beginning of a project. Doing stakeholder mapping early on will help prevent miscommunication, ensure all groups are aligned on the objectives and set expectations about outcomes and results.
Family Tree Template
Works best for:
Education, Mapping
Family trees help you make sense of complicated family relationships, even generations back. With this Family Tree Template, you can quickly and easily add your siblings, parents, and extended family members. Plus, add extra information, notes, and even images to create a vibrant family tree.
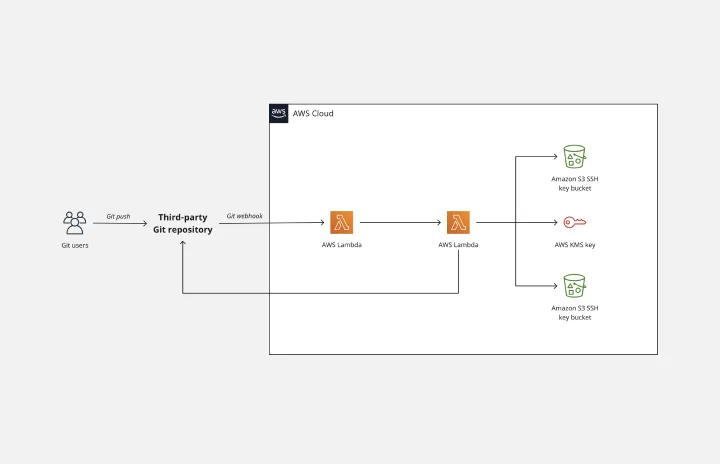
AWS Git to S3 Webhooks Template
Works best for:
Software Development, Diagrams
The AWS Git to S3 Webhooks Template is a visual representation of Git webhooks with AWS services Quick Start architecture. You can now have an overview of your AWS architecture with Miro’s AWS Git to S3 Webhooks Template, track your cloud solutions easily, and optimize processes like never before.

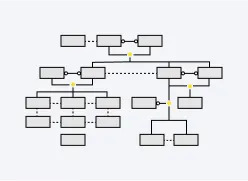
Opportunity Solution Tree Template
Works best for:
Flowcharts, Product Management, Diagrams
Solving problems — successful companies and productive teams just know how to do it. They’re able to identify many possible solutions, then settle on the one that leads to the desired outcome. That’s the power an Opportunity Solution Tree gives you. Designed by Teresa Torres, a product discovery coach, this mind map breaks down your desired outcome into opportunities for the product to meet user needs, then gives your team an effective way to brainstorm potential solutions.
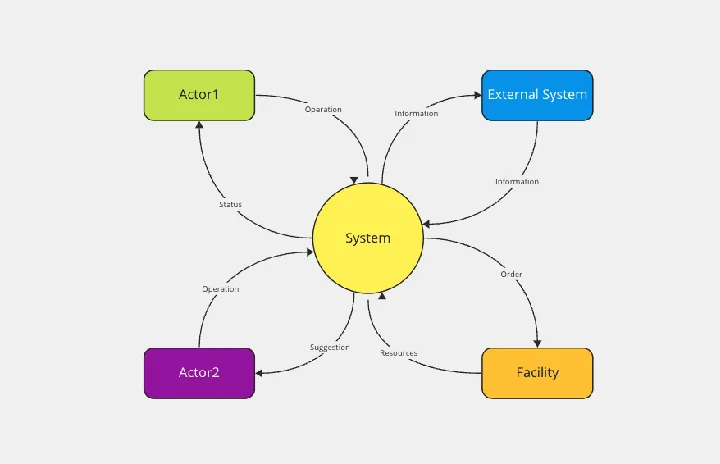
System Context Diagram
Works best for:
Diagramming
The System Context Diagram template is a visual tool for illustrating the relationships between a system and its external entities. It provides elements for depicting system boundaries, interfaces, and interactions with external stakeholders. This template enables teams to understand the broader context in which a system operates, facilitating requirements analysis and design decision-making. By promoting clarity and alignment, the System Context Diagram empowers teams to design systems that meet stakeholder needs and integrate seamlessly with their environment.
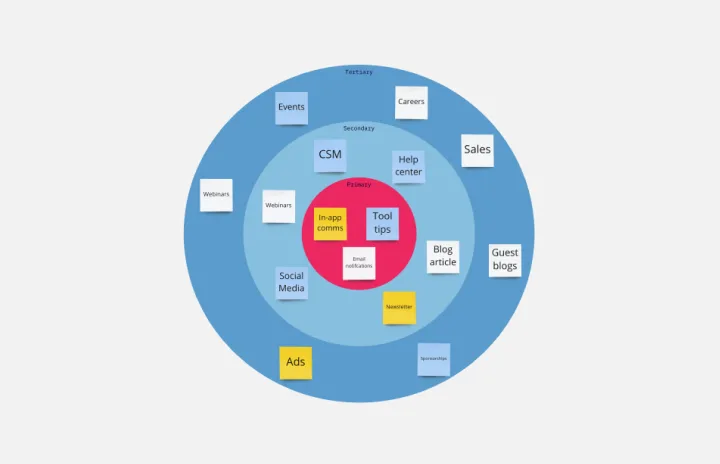
Bull's Eye Diagram Template
Works best for:
Diagrams, Project Management, Prioritization
When you’re a growing organization, every decision can feel like it has make-or-break consequences—which can lead to decision paralysis, an inability to prioritize, inefficient meetings, and even low morale. If that sounds like you, put a Bull’s Eye Diagram to work. True to its name, a Bull’s Eye Diagram uses a model of concentric circles to help companies establish priorities, make critical decisions, or discuss how to remove or overcome obstacles.