Genogram Template
More than a family tree, use this genogram template to map out detailed data and hereditary trends. Identify patterns and in-depth family dynamics.
Trusted by 65M+ users and leading companies


About the Genogram Template
A genogram template is a great tool to illustrate family structures and relationships. Its broad nature helps detail patterns and understand familial connections, making it essential for professionals across different domains.
The template is a graphical representation of a family tree that showcases relationships between members and generations within a family. It goes beyond the traditional family tree by adding more details, including emotional relationships and significant life events. With their visual nature, genograms can briefly represent complex family ties and histories, making it easier to identify behavior patterns and recognize hereditary tendencies.
How to use the genogram template
Filling in the genogram template is a straightforward process. With just a few clicks, elements within the template can be edited to reflect specific familial relationships and dynamics. Names, relationships, and details can easily be added and adjusted.
1. Add symbols
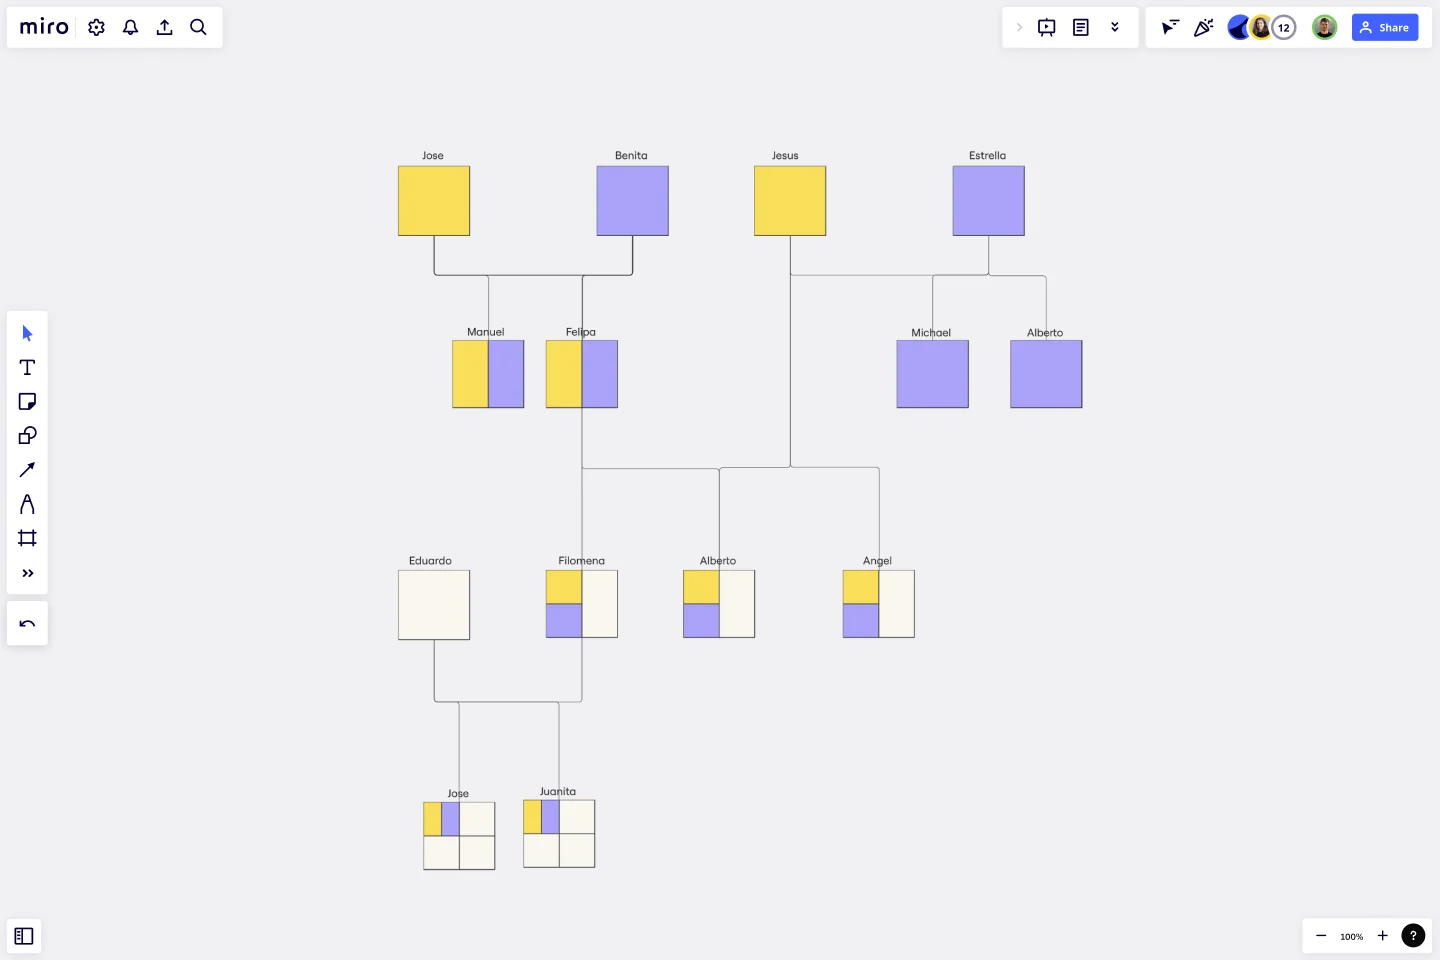
Open the template and use Miro’s extensive shapes library to represent family members. Typically, males are represented by squares and females by circles. Arrange the symbols from left to right, starting with the oldest generation at the top and moving down to the youngest.
2. Draw connections
Build on the template by using lines to connect family members. For instance, a horizontal line between two shapes indicates a marital relationship, while a vertical line dropping down from a couple can connect to their children.
You can indicate other relationships, such as divorces, with different types of lines (e.g., dotted or double lines). Make sure to decide on a legend or key for these symbols and lines.
3. Expand your genogram
Miro’s automated diagramming features make it easy to expand the genogram, accommodating larger families without complicating the design.
4. Embed other materials
Any relevant artifact, whether a photograph, document, or note, can be incorporated onto the board for a more enriched view.
5. Collaborate and share
With Miro as your genogram maker, you can invite others to collaborate if you're working as a team or if you want family members to provide input. Use the sharing options to share your genogram with others or to export it as an image or PDF.
Why should you use a genogram template?
Easy to create and update: By using a template to create a genogram, you can easily customize the diagram and keep it up-to-date.
Deep insights: Unlike basic family trees, genograms delve deeper into the nuances of relationships, offering insights into patterns and trends that may be hereditary or environmental.
Holistic view: By encompassing emotional, medical, and relational aspects, the template provides a comprehensive perspective on familial dynamics.
Adaptable application: Many professionals can benefit from the detailed structure of genograms, from therapists to genealogists to educators.
Efficient communication: The visual format ensures easy interpretation and can be a visual aid for professionals explaining intricate relationships to clients or colleagues.
Problem identification: By visualizing problematic relationships or patterns, interventions or solutions can be more effectively designed and implemented.
What's the difference between a family tree and a genogram?
While both tools represent family structures, a genogram is more detailed, highlighting emotional ties, medical history, and other significant life events.
How detailed should a genogram template be?
The depth of detail largely depends on its intended use. For some, basic relationships suffice, while others may need intricate details for therapeutic or research purposes.
Is there a limit to how large the genogram can be?
The automated diagram feature can expand the template to accommodate large family structures, ensuring clarity and coherence.
Can I collaborate with others on this genogram template?
Yes, collaboration is a built-in feature, allowing multiple contributors to edit, view, and comment in real time, making the process interactive and comprehensive.
Get started with this template right now.
Yes No Flowchart Template
Works best for:
Diagramming
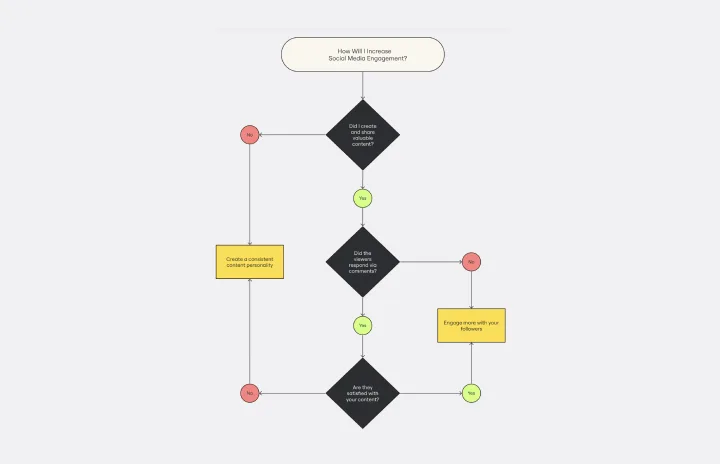
The Yes-No Flowchart Template is a simple and efficient tool that helps to simplify complex decision-making processes into clear and easy-to-follow steps. This template uses standard shapes to illustrate processes, decisions, and outcomes, with arrows that guide users from one action point to the next based on binary 'yes' or 'no' decisions. Its most prominent benefit is its ability to bring clarity to decision-making. By presenting processes visually, teams can effortlessly understand and navigate complex scenarios, ensuring that each step is transparent and reducing the potential for misunderstandings or missteps.

Production Flowchart Template
Works best for:
Diagramming, Flowcharts
The Production Flowchart Template is a well-crafted tool that clearly represents a production process from start to finish. It breaks down complex procedures into easy-to-understand segments, making it easier for stakeholders to grasp the entire process. One of the key benefits of using this template is that it helps to clarify complex production pathways. By mapping out operations visually, teams can identify potential bottlenecks or inefficiencies, facilitating timely and well-informed decision-making.
Pedigree Diagram Template
Works best for:
Diagrams, Education
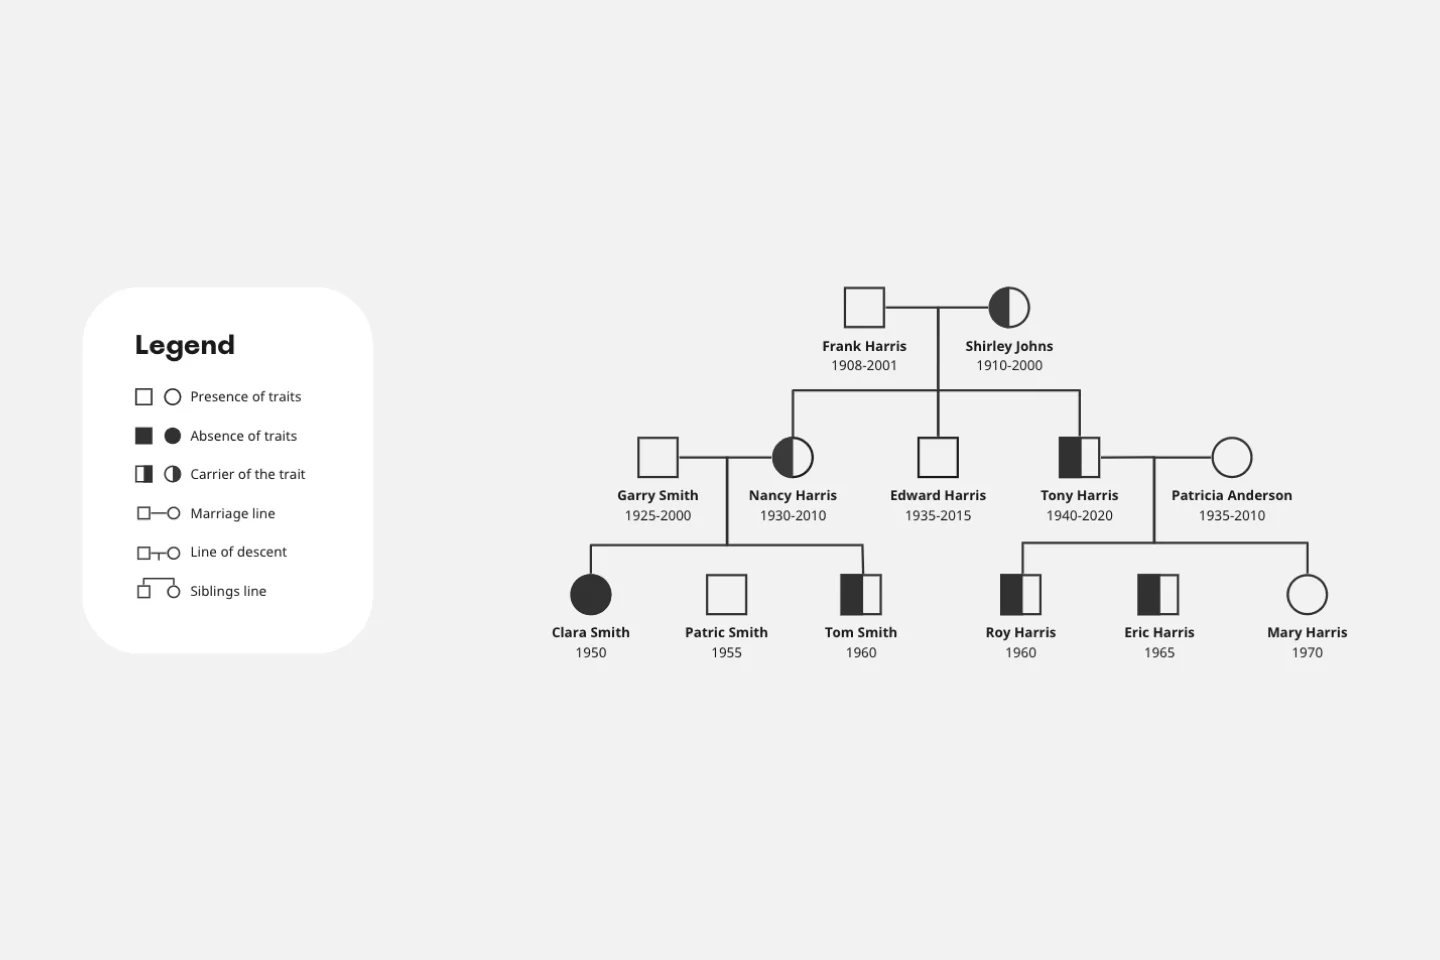
Use our Pedigree Diagram Template to show how traits and diseases are passed from one generation to the next. Whether you’re a doctor, farmer, or just someone interested in genetics, a Pedigree Diagram can help you identify hereditary traits.
Business Intelligence Architecture Template
Works best for:
Diagramming
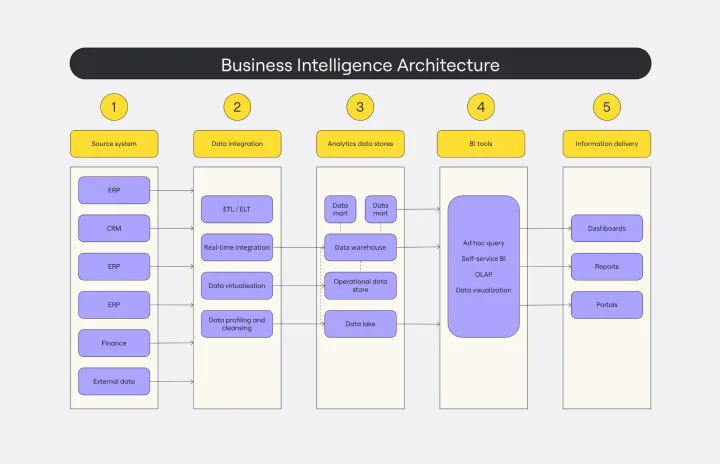
The Business Intelligence Architecture Diagram Template in Miro visually maps the complex landscape of business intelligence systems. With elements encompassing data sources, warehouses, ETL processes, tools, and end-user interfaces, the template enables users to communicate complex concepts with clarity. One standout feature is the template's dynamic adaptability, empowered by Miro's automated diagramming capabilities. This feature ensures that the diagram remains up-to-date with minimal effort, allowing users to effortlessly incorporate changes in data structures and processes, thus maintaining the relevance and accuracy of their visual representations over time.

Azure Architecture Diagram Template
Works best for:
Software Development, Diagrams
The Azure Architecture Diagram Template is a diagram that will help you visualize the combination of any data and build and deploy custom machine learning models at scale. Azure is Microsoft’s cloud computing platform, designed to provide cloud-based services such as remote storage, database hosting, and centralized account management. Use Azure Architecture Diagram template to build sophisticated, transformational apps.
UML Diagram Template
Works best for:
Diagrams, Software Development
Originally used as a modeling language in software engineering, UML has become a popular approach to application structures and documenting software. UML stands for Unified Modeling Language, and you can use it to model business processes and workflows. Like flowcharts, UML diagrams can provide your organization with a standardized method of mapping out step-by-step processes. They allow your team to easily view the relationships between systems and tasks. UML diagrams are an effective tool that can help you bring new employees up to speed, create documentation, organize your workplace and team, and streamline your projects.