Force Field Analysis Template
Identify driving and restraining forces, prioritize actions, and build team consensus for effective decision-making with the force field analysis template.
Trusted by 65M+ users and leading companies


About the Force Field Analysis Template
Force Field Analysis is a powerful tool that can help you identify and analyze the various factors that can impact the success of a project or initiative. The force field analysis template is a great way to get started with this technique, allowing you to quickly visualize and organize your thoughts in a collaborative and dynamic way.
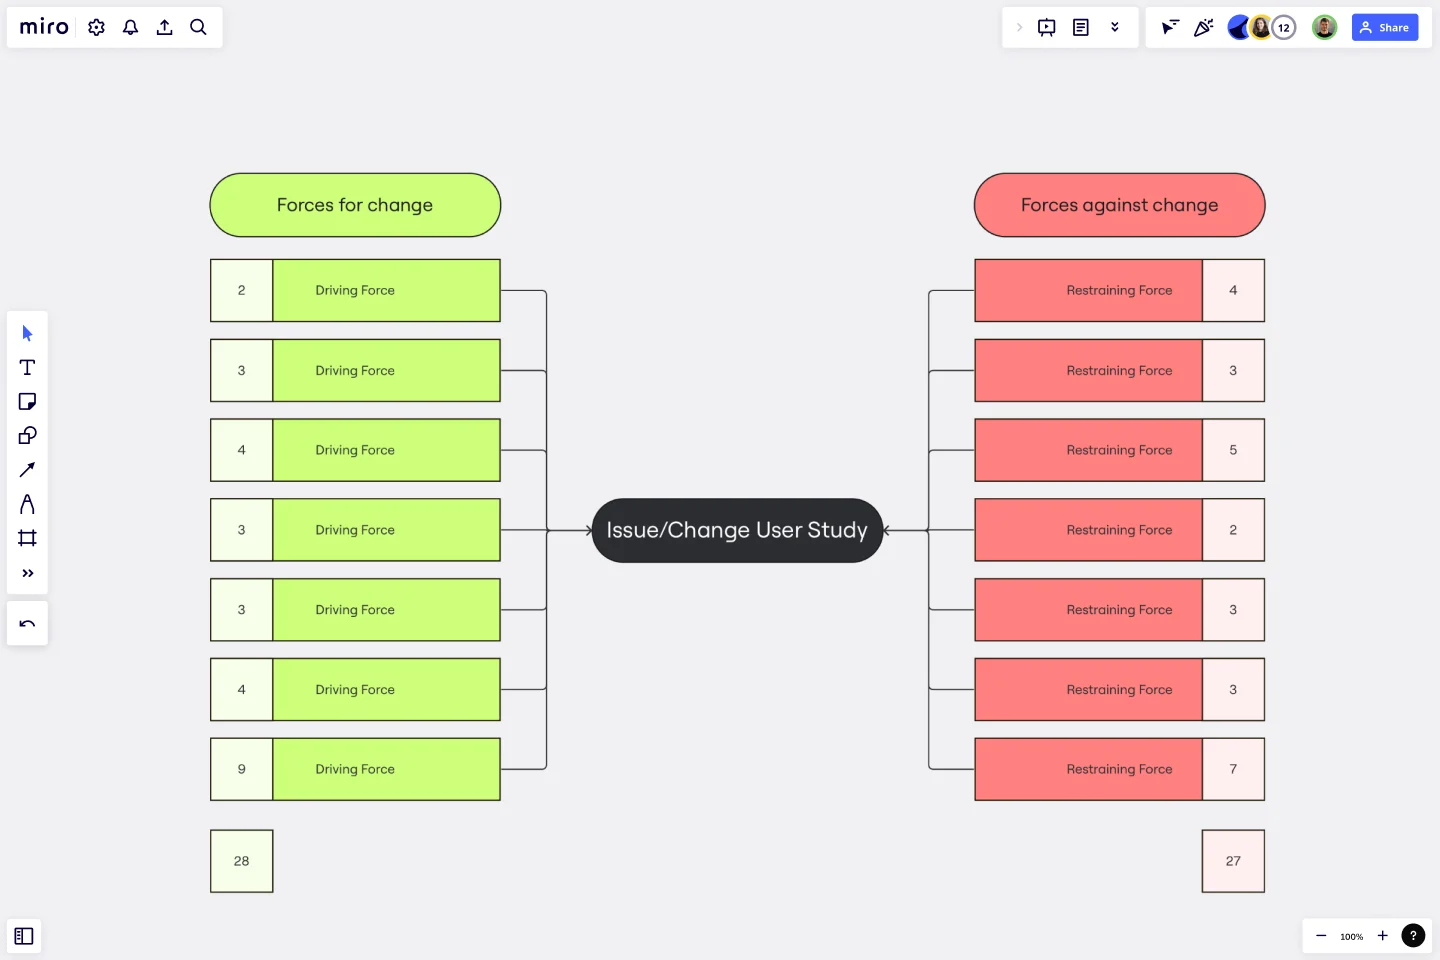
What is the force field analysis template?
The force field analysis template is a simple yet effective way to understand and analyze the forces that can influence the success of your project. It consists of two main areas - driving forces and restraining forces - which can be broken down into more specific factors.
For example, driving forces might include factors such as increased revenue, improved customer satisfaction, or enhanced productivity, while restraining forces might include factors such as increased competition, budget constraints, or lack of resources.
How to use the force field analysis template in Miro
Here are the steps to use the Force Field Analysis template in Miro:
Open the template in your Miro board.
Start editing the template by adding or removing shapes and connector lines.
Use automated diagramming features to expand the template as needed.
Add any artifact on a Miro board to provide more context to your analysis.
Why should you use a force field analysis template?
There are many benefits to making a force field analysis, including:
Increased clarity: The template can help you identify the key factors that are driving or restraining your project, allowing you to focus on the most important areas.
Improved decision-making: By analyzing the various factors that impact your project, you can make more informed decisions about how to move forward.
Enhanced collaboration: The template allows you to work collaboratively with your team, fostering communication and collaboration.
Increased creativity: The force field analysis template helps you think outside the box and come up with innovative solutions to complex problems.
Better alignment: By identifying the key driving and restraining forces, you can ensure that your team is aligned around a common goal.
Do you need more advanced diagramming? Miro's extensive shape pack library, collaboration features, and technical diagramming capabilities provide robust solutions for teams.
Can I customize the template to fit my specific needs?
Absolutely! The template is fully customizable, allowing you to add or remove shapes and connector lines as needed.
How can I collaborate with my team on the template?
Miro allows for real-time collaboration, so you can work together with your team in real-time, no matter where you are.
Can I export the template to other platforms?
Yes, Miro allows you to export your templates to various formats, including PDF, PNG, and JPEG.
Get started with this template right now.
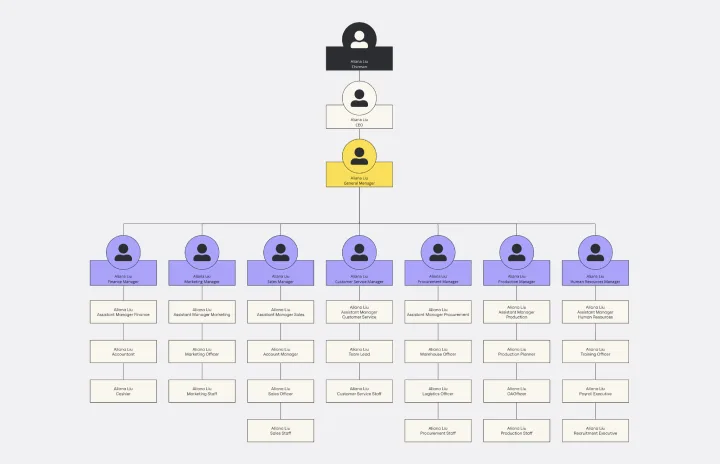
Vertical Organizational Chart
Works best for:
Organizational Charts, Organizational Design
The Vertical Organizational Chart Template is an efficient way to illustrate the hierarchy of an entity in a top-down format. This tool helps represent roles and relationships in a clear manner, starting from the topmost authority and branching downwards. It allows for a better understanding of the flow of responsibilities and communication channels within the organization. One of its most significant advantages is promoting clear communication. Depicting the organization's structure helps avoid misunderstandings and ensures everyone is on the same page regarding the chain of command.
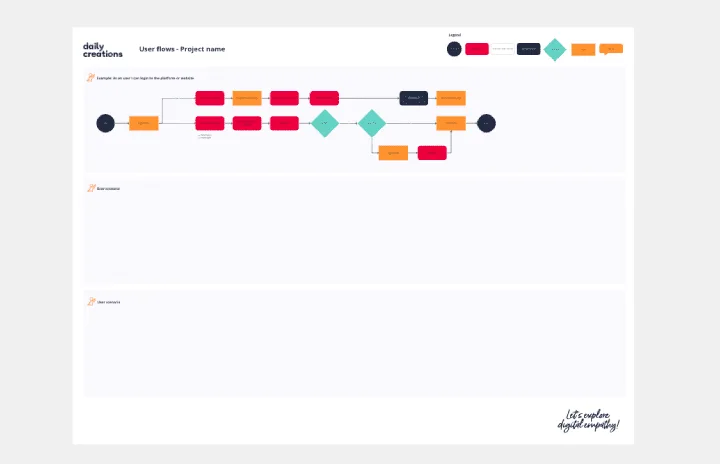
User Flows
The User Flows template offers a visual tool for mapping out the sequence of steps that users take to accomplish a specific task or achieve a goal within a digital product or service. It provides elements for documenting user interactions, screens, and decision points along the user journey. This template enables UX designers and product teams to understand user behaviors, identify pain points, and optimize the user experience effectively. By promoting user-centric design and empathy, the User Flows template empowers teams to create intuitive and engaging digital experiences that meet user needs and drive satisfaction.
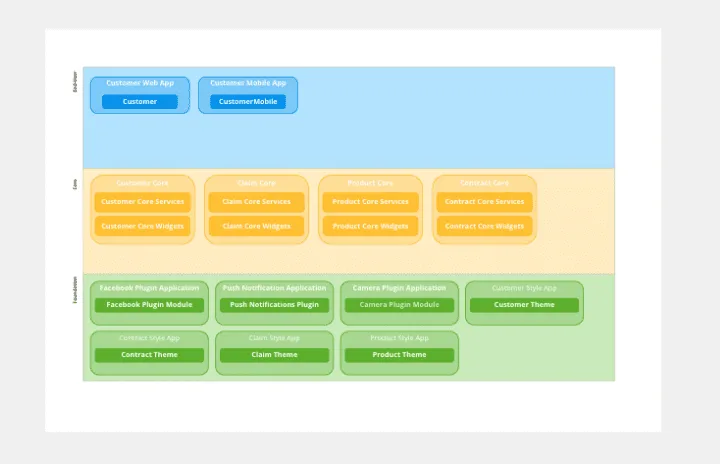
OutSystems Architecture Diagram
Works best for:
Diagramming
The OutSystems Architecture Diagram template offers a visual tool for designing and documenting software architectures using the OutSystems platform. It provides elements for modeling application components, data structures, and integration points. This template enables teams to visualize and communicate the architecture of their OutSystems applications, facilitating collaboration and alignment among developers and stakeholders. By promoting clarity and understanding of system architecture, the OutSystems Architecture Diagram empowers teams to build scalable, maintainable, and high-performance applications effectively.
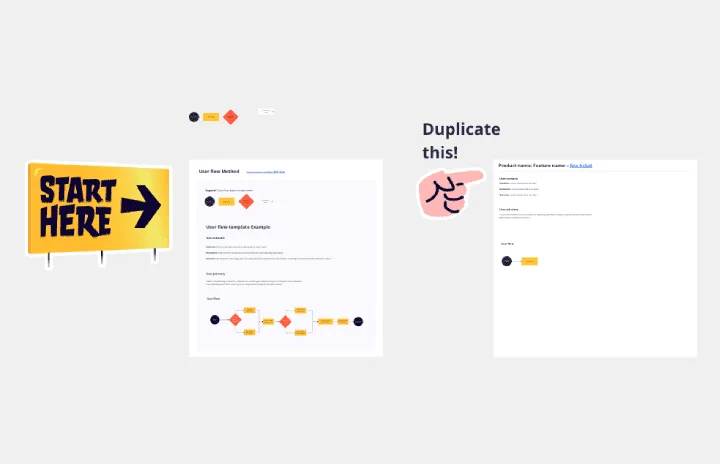
User Flow Example
Works best for:
Flowcharts, Mapping, Diagrams
The User Flow Example template offers a visual representation of a typical user flow within a digital product or service. It provides elements for documenting user interactions, navigation paths, and decision points along the user journey. This template enables UX designers and product teams to understand user behavior, identify pain points, and optimize the user experience. By providing a concrete example of user flow, the User Flow Example template serves as a valuable reference for designing intuitive and engaging digital experiences that meet user needs effectively.
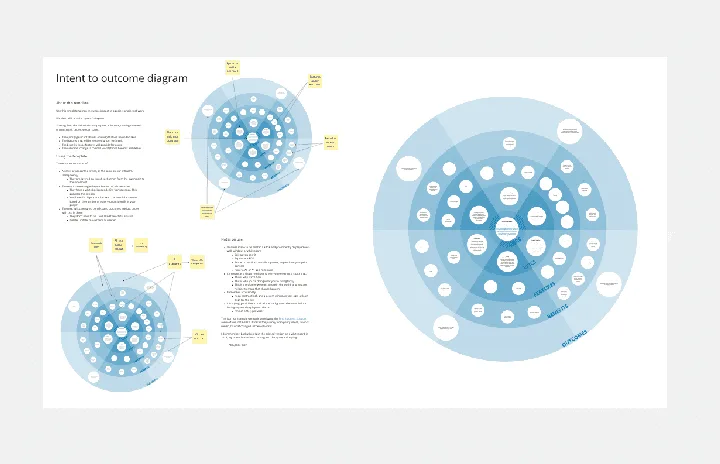
Intent to Outcome Diagram
Works best for:
Diagramming
The Intent to Outcome Diagram template is a visual tool for mapping out the relationship between desired outcomes and the actions required to achieve them. It provides a structured framework for defining intentions, outcomes, and key activities. This template enables teams to align on goals, track progress, and identify areas for improvement. By promoting clarity and alignment, the Intent to Outcome Diagram empowers organizations to set strategic direction and drive results effectively.
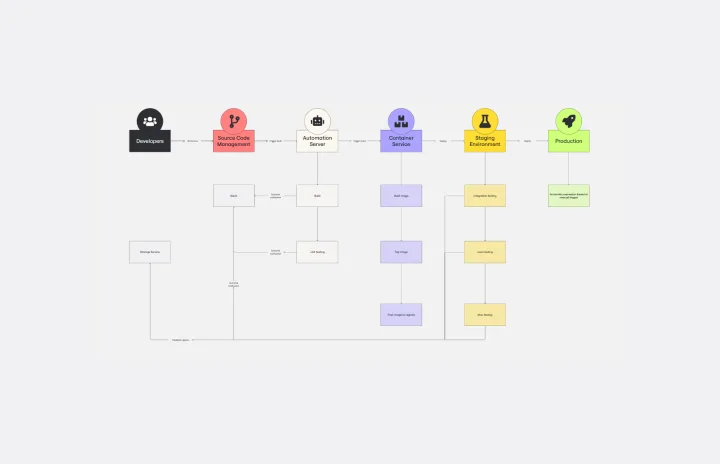
CI/CD Pipeline Diagram Template
Works best for:
Diagramming, Development
The CI/CD template is a well-designed roadmap for software deployment that enables a smooth and automated flow from development to production. This strategic layout includes critical elements such as source code management, automation servers, container orchestration, staging environments, and the final deployment to production. One of the key benefits of using such a template is that it builds a robust deployment pipeline, which significantly reduces manual intervention and human error. By visualizing each step and integrating automation throughout, teams can achieve faster deployment cycles, ensuring that new features, updates, and fixes are delivered to users promptly and reliably. This enhanced pace does not compromise quality, as the template inherently supports continuous testing and quality assurance, ensuring that each update is quick but also secure and stable before it is delivered to the end user.