
FMEA Analysis Template
Identify risks so you can optimize and stabilize business processes.
Trusted by 65M+ users and leading companies


About the FMEA Analysis Template
FMEA stands for Failure Mode and Effects Analysis. FMEA is a tool that helps organizations identify problems with a product, service, or process in order to assess their potential impact.
Customers expect the best. They want quality and consistency. But problems still arise — and they can be expensive. Finding a problem or defect late in the production cycle can be expensive and cause costly delays.
This FMEA analysis template enables you to discover potential issues before they impact the customer. Understand your potential failures and their associated risks, put together action plans to fix those problems, and evaluate the results of those action plans.
How to complete an FMEA analysis in 5 steps
The FMEA analysis template guides you through the systemic process of identifying risks in business processes. The template covers the following aspects:
Failure Mode - The way in which a process, product, or system could potentially fail. For example, a failure mode in a manufacturing process could be a machine malfunction, a software bug, or a material defect.
Effects - The consequences or outcomes resulting from the identified failure modes. This step involves assessing the impact of each failure mode on the overall process or system.
Analysis - This step involves a systematic and thorough examination of the identified failure modes and their effects. The goal is to understand the potential causes of failure and the implications for the overall system.
Here's a breakdown of how to use the template effectively:
Step 1: Pick the process
First, you need to identify the process you’d like to examine. This shouldn’t be a simple one or two-step process, but something more intricate with more downstream effects. Use your process map to review the steps in that process.
Step 2: Identify failure modes
Now, you need to brainstorm potential failure modes for each step — that is, any way in which that step might fail to perform its intended function.
Step 3: Estimate the impact
After you’ve identified each potential cause of a failure, you need to brainstorm potential effects associated with each failure mode. If the step fails, how will it impact the process, system, or product? Be as specific as possible.
Step 4: Assign a severity ranking
Now, you have to determine the potential damage of this failure occurring by assigning a Risk Priority Number (RPN). If this failure occurred, how severe would the impact be? Consider the impact on your customers, operations, or your employees. How frequently do you think this failure might occur? Is it likely to occur often? Or is it rare?
Step 5: Develop a plan
Finally, you need to develop a recommended action — or multiple actions — that deal with the problem. How can you go about fixing the problem, or reducing its severity? Who is responsible for fixing it? What does the timeline look like?
What is the general purpose of FMEA?
The general purpose of an FMEA analysis is to identify and prevent potential failures in a product, service, or process before they cause damage.
How do you identify failure modes?
To identify failure modes, first you have to pick a process and walk through the various steps of the process. Once you’ve spelled out each step, think of any action related to completing this step in the overall process. Then, assess each action individually and determine if there are ways that it can go wrong (failure modes). This can be technical failure or human error.
Get started with this template right now.
Azure Data Flow Template
Works best for:
Software Development, Diagrams
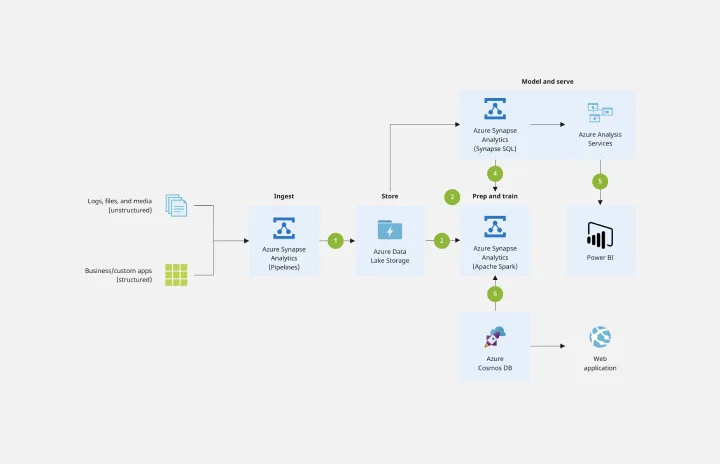
The Azure Data Flow is a diagram that will allow you to combine data and build and deploy custom machine learning models at scale. Azure is Microsoft’s cloud computing platform, designed to provide many cloud-based services like remote storage, database hosting, and centralized account management. Azure also offers new capabilities like AI and the Internet of Things (IoT).
Meeting Notes Template
Works best for:
Business Management, Meetings
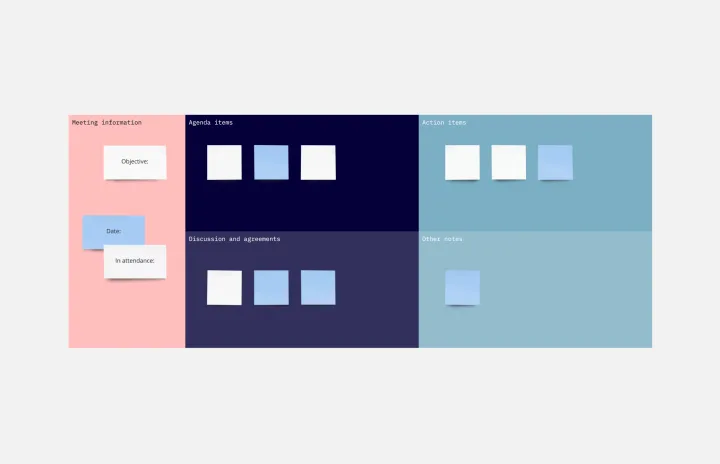
When your meeting is a success (and Miro will help make sure it is), participation will run high, brilliant ideas will be had, and decisions will be made. Make sure you don’t miss a single one — use our meeting notes template to track notes and feedback in a centralized place that the whole team can access. Just assign a notetaker before the meeting, identify the discussion topics, and let the notetaker take down the participants, important points covered, and any decisions made.
Infographic Template
Works best for:
Marketing, Desk Research, Documentation
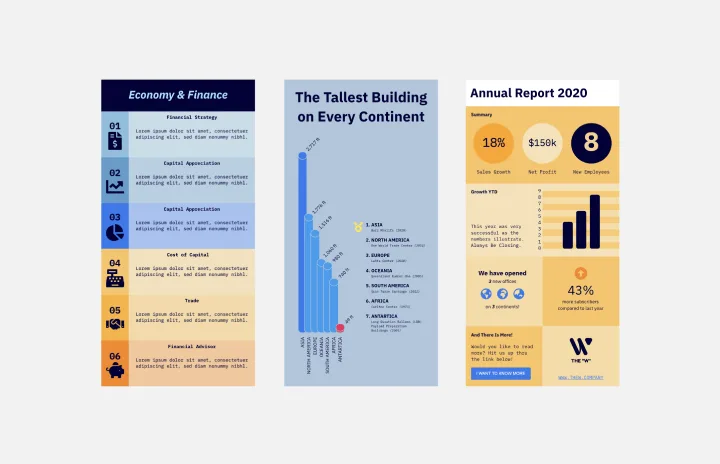
As we bet you’ve experienced, data can get pretty dense and dry. But you need it to be compelling, memorable, and understandable. The solution? Infographics. These are tools that let you present information in a visually striking way and turn quantitative or qualitative data into stories that engage and resonate. Whoever you’ll be presenting to — customers, donors, or your own internal teams — our template will let you design an infographic that combines text and visuals to break down even the most complicated data.
BPMN Template
Works best for:
Mapping, Diagrams, Business Management
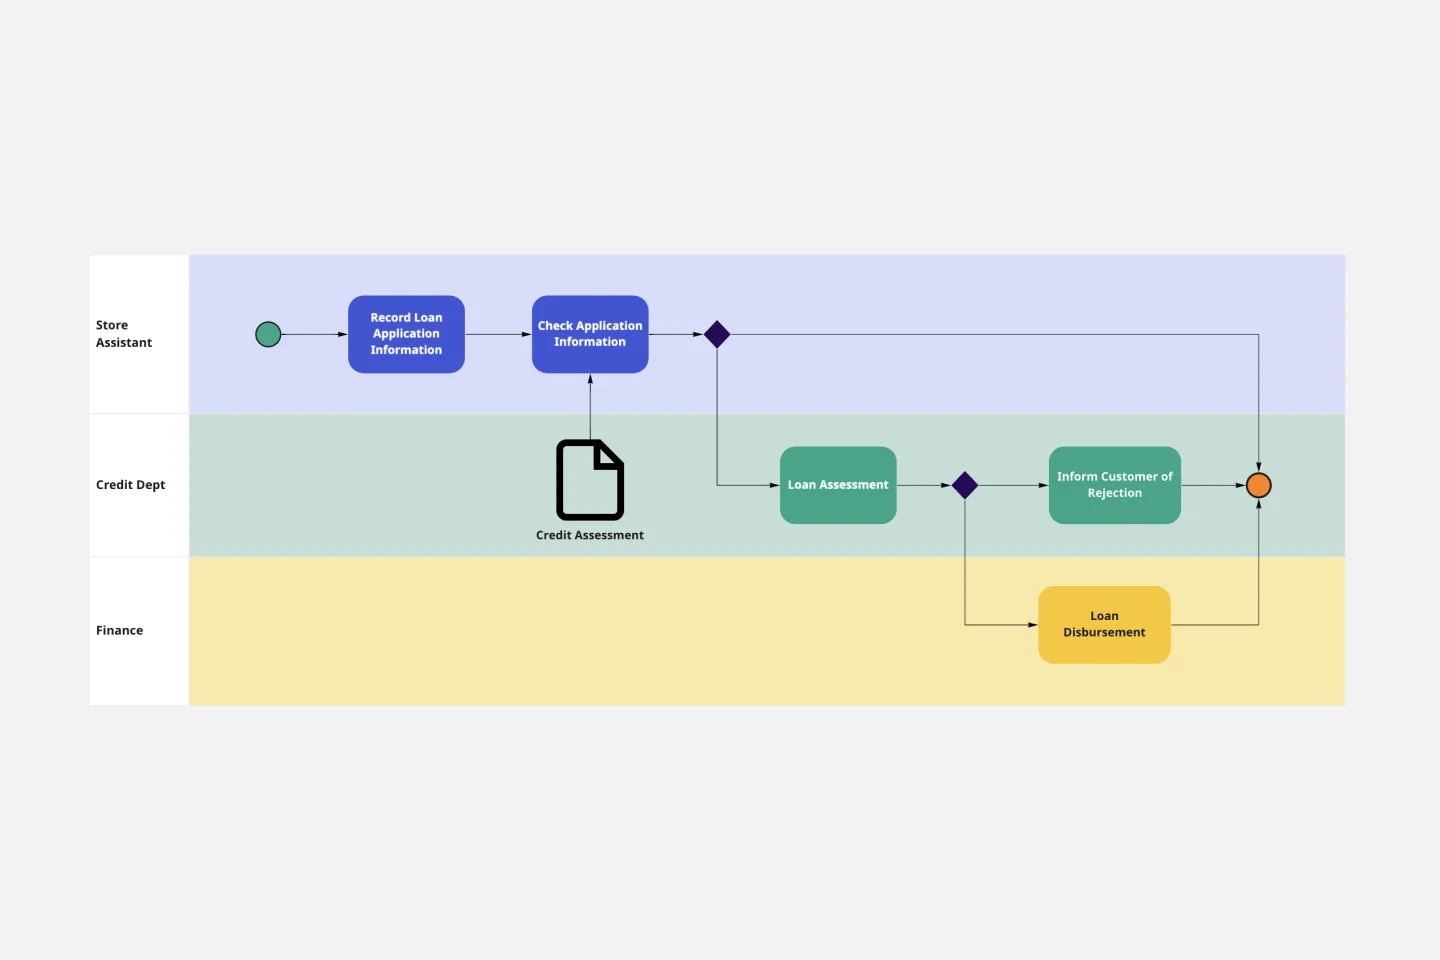
The BPMN template helps you track and get an overview of your business processes. It’s a great way to identify any bottlenecks and make your operations more efficient. The BPMN methodology became a universal language when managing business processes, and multiple industries use it as a management tool. Project managers, business analysts, and IT administrators use the BPMN process flow diagram to manage projects, visually communicate the process flows, and keep track of process constraints. Try it for yourself and see improvements in your organization’s agility.
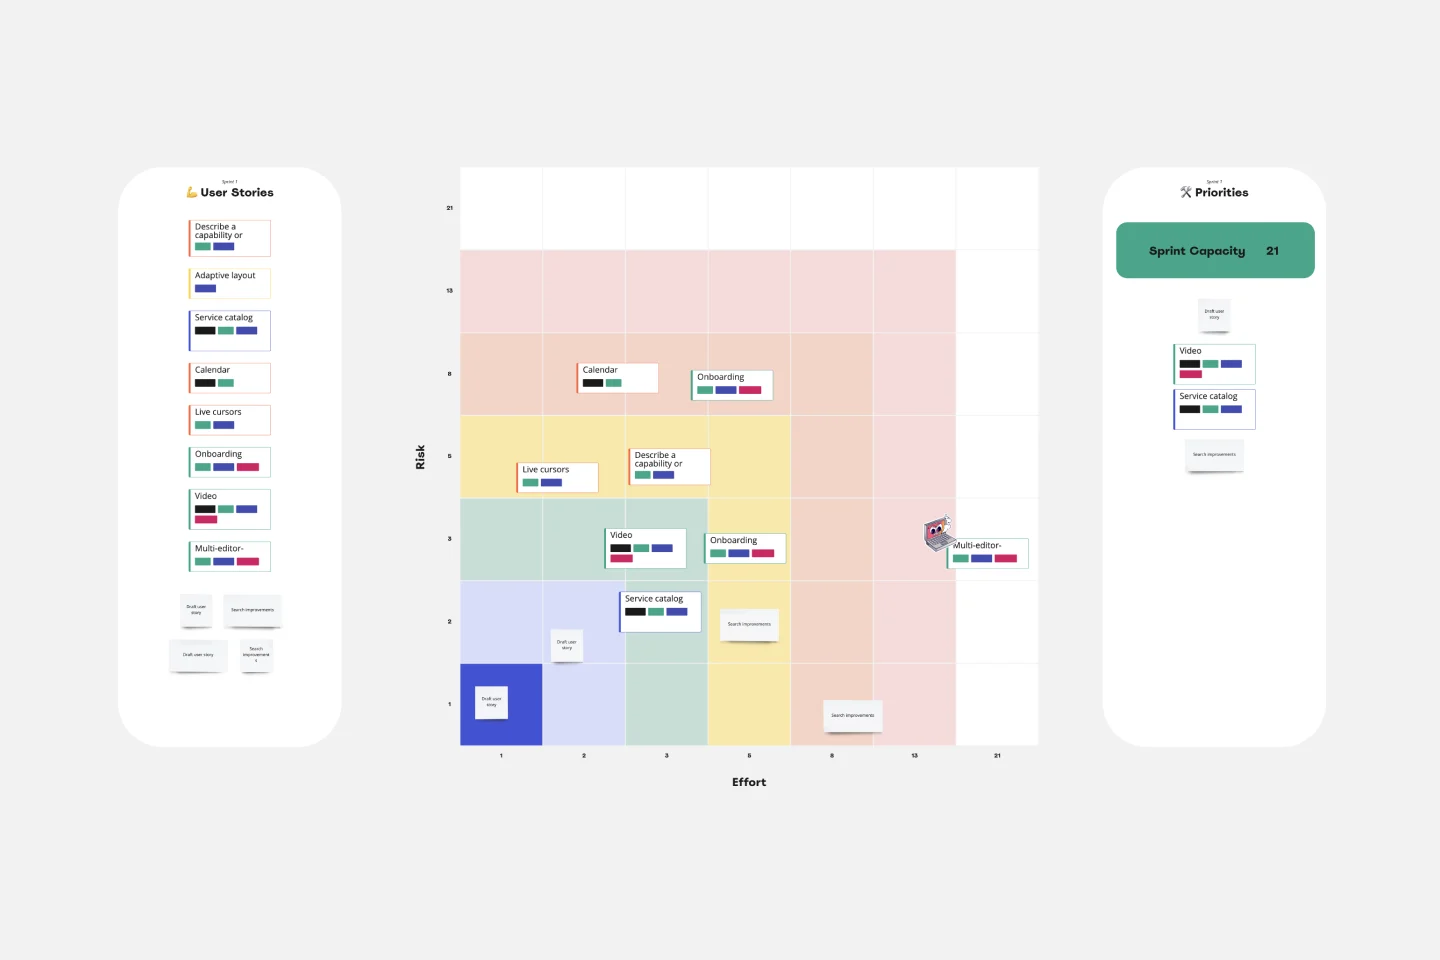
Fibonacci Scale Template
Works best for:
Agile Methodology, Prioritization, Agile Workflows
When you manage a team, you often have to estimate how much time and effort tasks will take to complete. Try what often works for Agile teams all over the world: Turn to the Fibonacci Scale for guidance. Based on the Fibonacci sequence, where each number is the summation of the two previous numbers (0, 1, 2, 3, 5, 8, 13, 21, etc.), this template can help you build timelines like a champ—by helping make sure that work is distributed evenly and that everyone is accurate when estimating the work and time involved in a project.
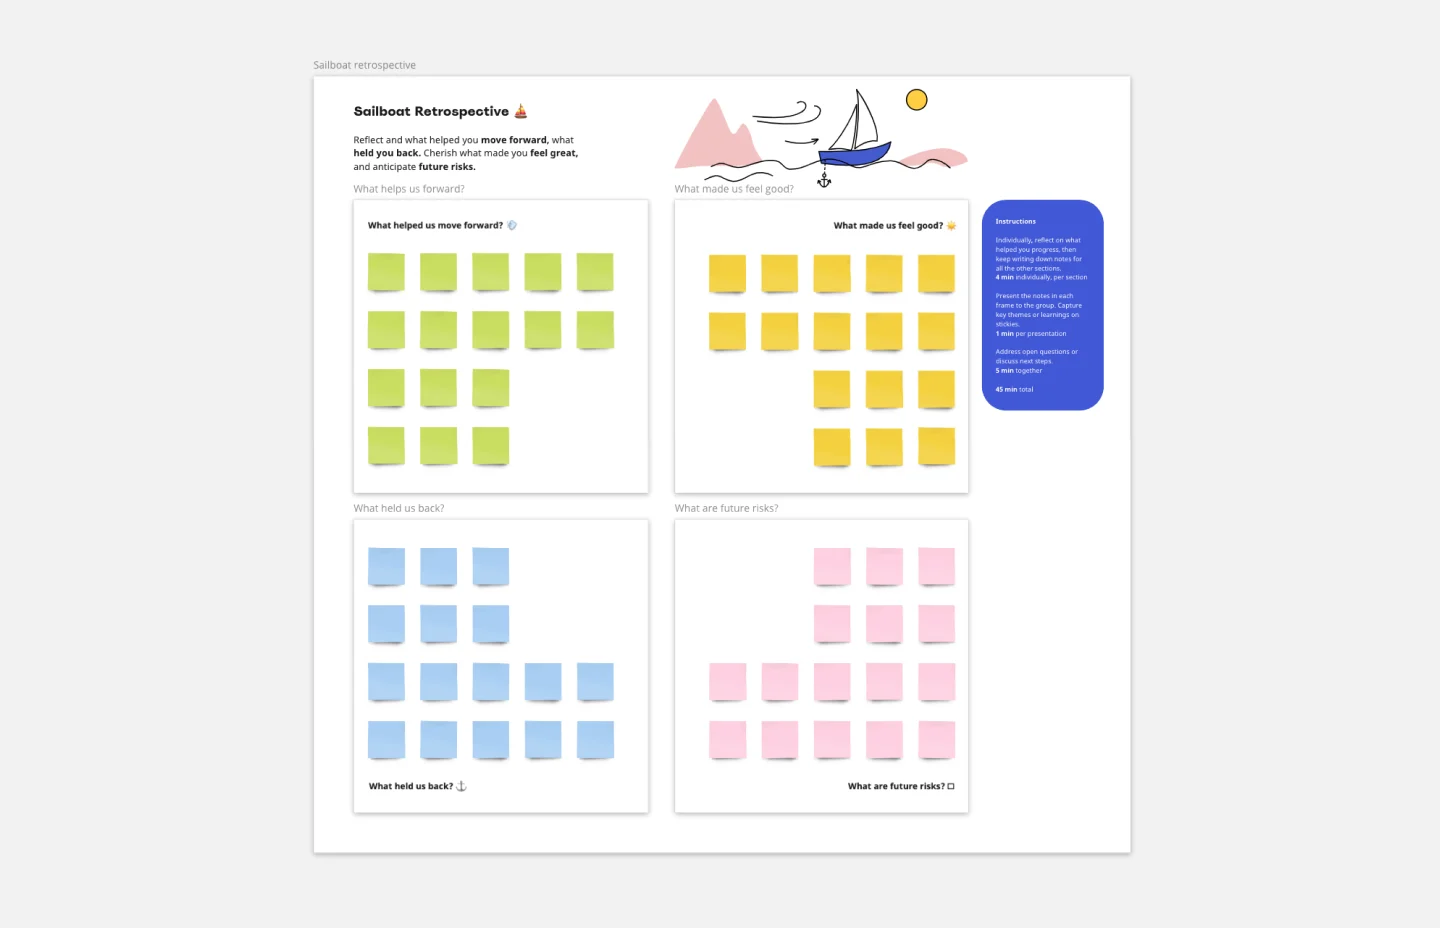
Sailboat Template
Works best for:
Agile Methodology, Meetings, Retrospectives
The Sailboat Retrospective is a low-pressure way for teams to reflect on how they handled a project. By defining your risks (the rocks), delaying issues (anchors), helping teams (wind), and the goal (land), you’ll be able to work out what you’re doing well and what you need to improve on for the next sprint. Approaching team dynamics with a sailboat metaphor helps everyone describe where they want to go together by figuring out what slows them down and what helps them reach their future goals.