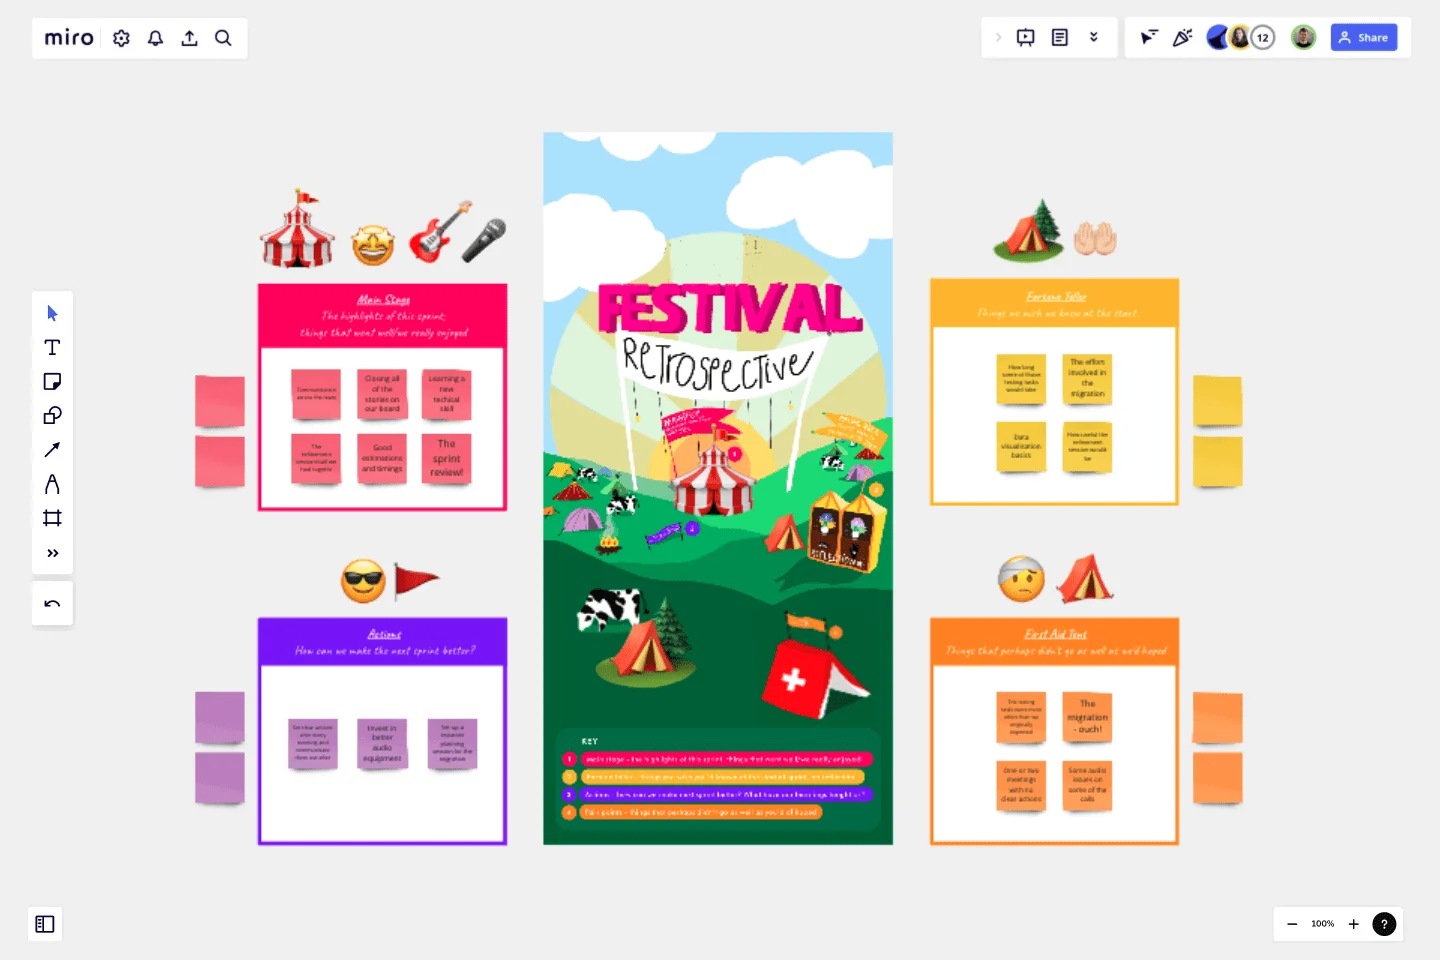
Festival Retrospective
The festival themed retrospective has been designed using the metaphors and common areas of a festival for teams to share ideas and key themes
Trusted by 65M+ users and leading companies


The retrospective is broken up into four main areas:
The Main Stage - highlights of the sprint/iteration; things that went well and that the team enjoyed
Fortune Teller - things we wish we knew at the start
First Aid Tent - pain points; things that perhaps didn't go as well as we'd have hoped
Actions - how can we make the next sprint/iteration better?
Use the blank post-it templates available and some of the example post-its as a starter and work your way around the board from Main Stage, to Fortune Teller, to the First Aid Tent, where the pain points identified by the team help to drive conversation and insight into the final Actions section.
Enjoy!
Credit for the creative and design to some of the fantastic designers working at Dyson.
Get started with this template right now.
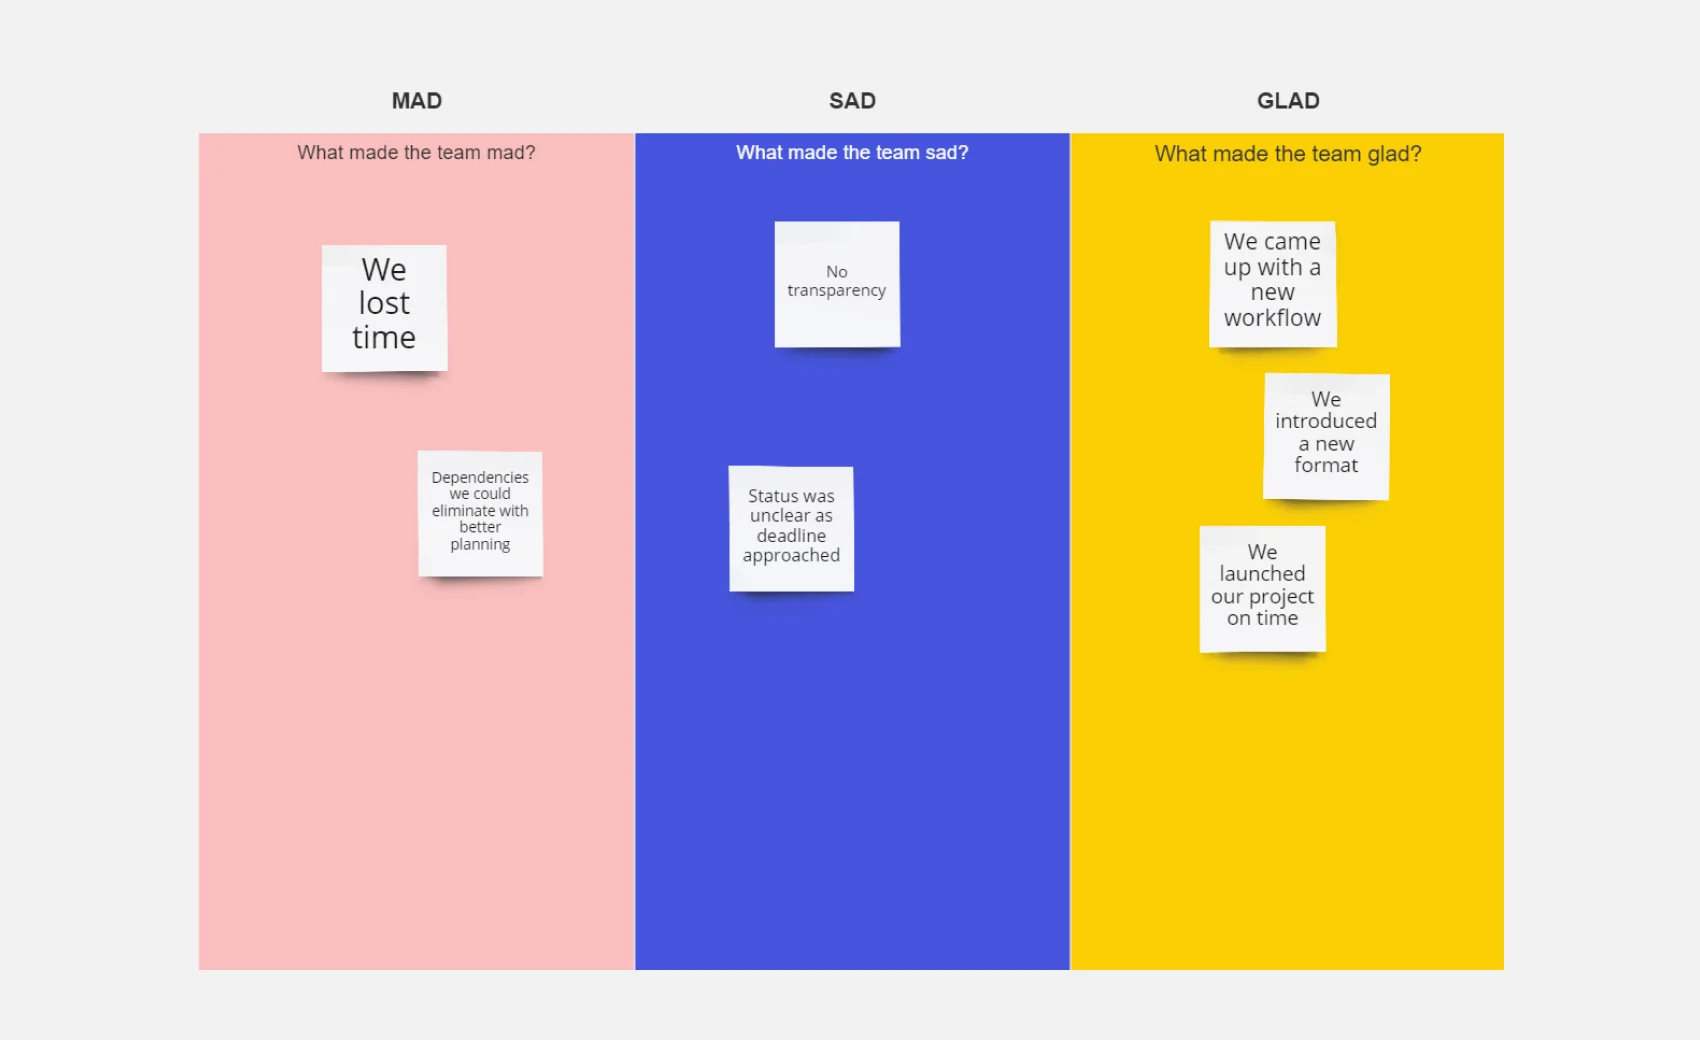
Mad Sad Glad Retrospective
Works best for:
Brainstorming, Ideation
It's tempting to measure a sprint’s success solely by whether goals and timelines were met. But there’s another important success metric: emotions. And Mad Sad Glad is a popular, effective technique for teams to explore and share their emotions after a sprint. That allows you to highlight the positive, underline the concerns, and decide how to move forward as a team. This template makes it easy to conduct a Mad Sad Glad that helps you build trust, improve team morale, and increase engagement.
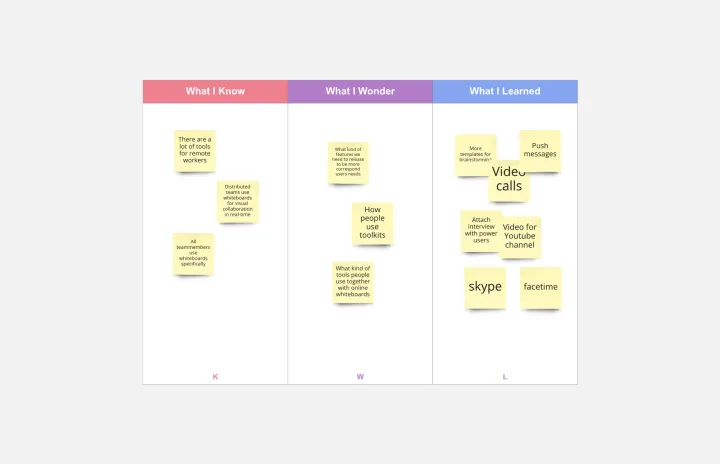
KWL Chart Template
Works best for:
Education, Brainstorming, Retrospectives
Sharing and learning new knowledge is the fuel in the tank of any ambitious team or organization. A KWL chart is a graphical organizer that powers the learning process. This easy template lets you design and use a KWL, with three columns: Know, Want to Know, and Learned. Then you and your team will fill in each column by following three steps: Take stock of what you know, document what you want to get out of your session, and finally, record what you’ve learned.
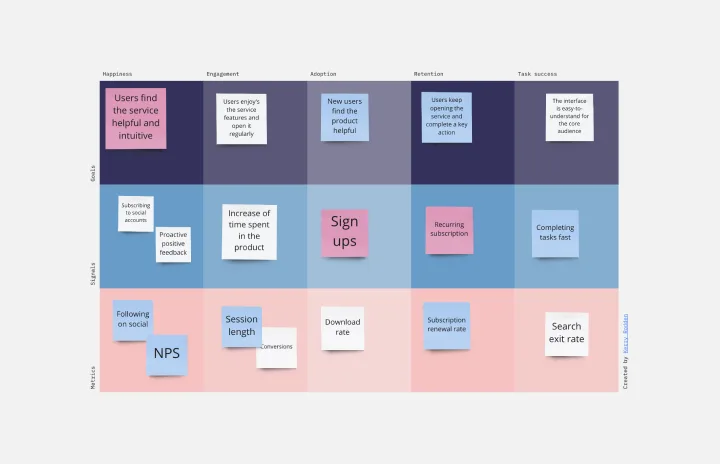
HEART Framework Template
Works best for:
Desk Research, Project Management, User Experience
Happiness, Engagement, Adoption, Retention, and Task Success. Those are the pillars of user experience — which is why they serve as the key metrics in the HEART framework. Developed by the research team at Google, this framework gives larger companies an accurate way to measure user experience at scale, which you can then reference throughout the product development lifecycle. While the HEART framework uses five metrics, you might not need all five for every project — choose the ones that will be most useful for your company and project.
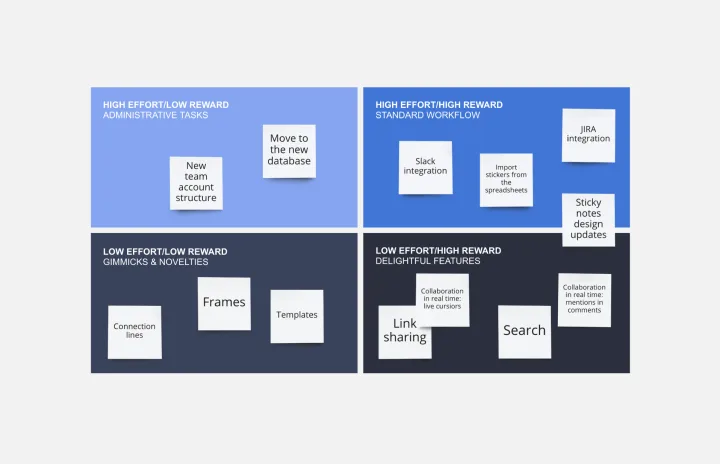
Cost-Benefit Analysis Template
Works best for:
Leadership, Decision Making, Strategic Planning
With so many day-to-day decisions to make—and each one feeling high-stakes—it’s easy for all the choices to weigh a business or organization down. You need a systematic way to analyze the risks and rewards. A cost benefit analysis gives you the clarity you need to make smart decisions. This template will let you conduct a CBA to help your team assess the pros and cons of new projects or business proposals—and ultimately help your company preserve your precious time, money, and social capital.
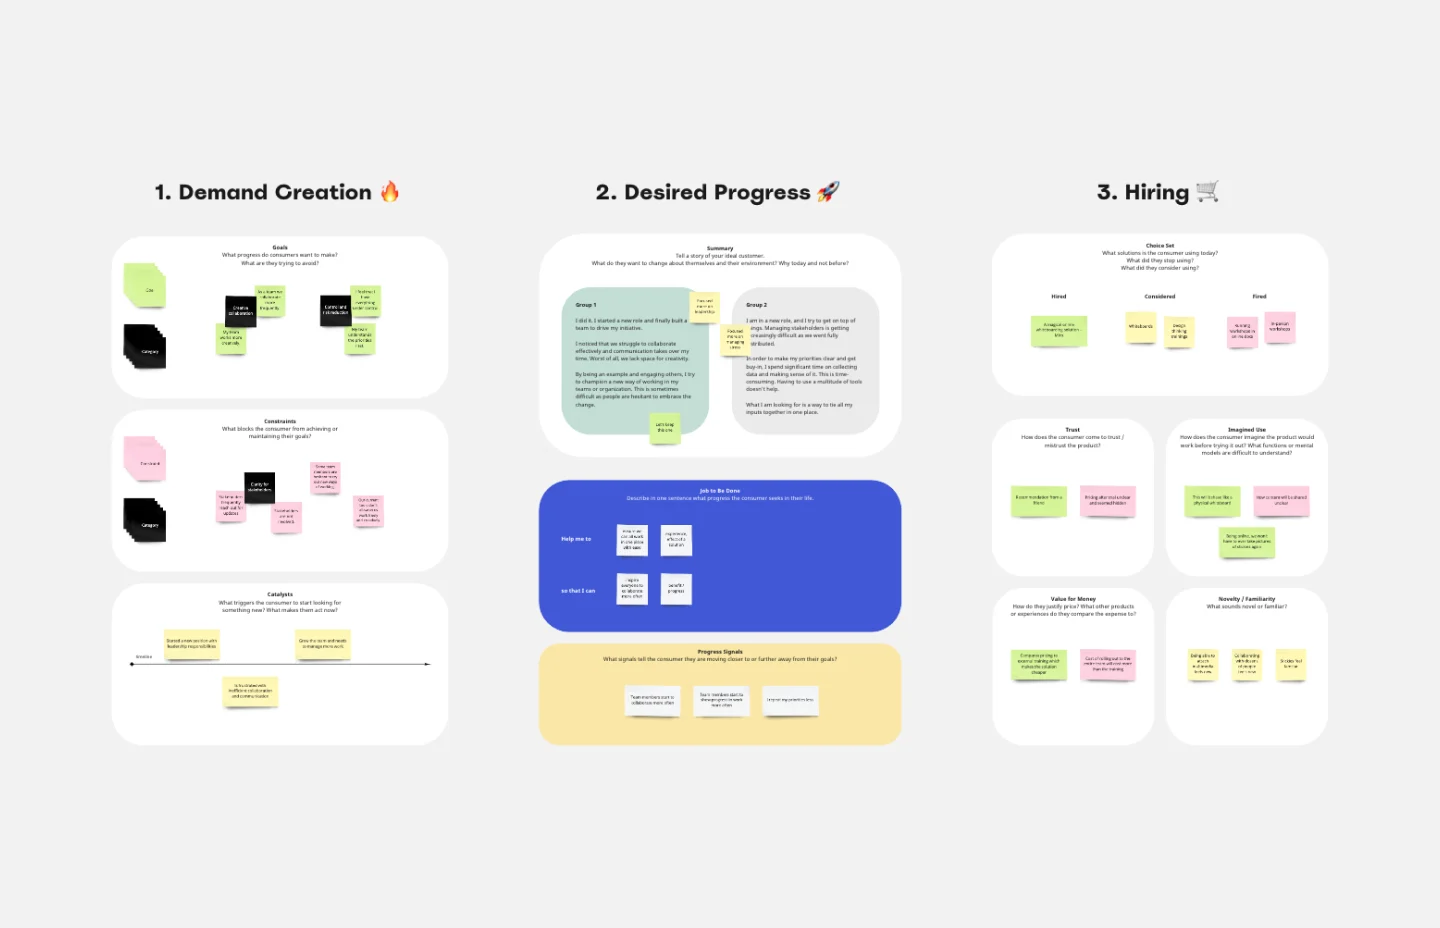
Jobs to be Done template
Works best for:
Ideation, Design Thinking, Brainstorming
It’s all about a job done right — customers “hire” a product or service to do a “job,” and if it's not done right, the customer will find someone to do it better. Built on that simple premise, the Jobs To Be Done (JTBD) framework helps entrepreneurs, start-ups, and business managers define who their customer is and see unmet needs in the market. A standard job story lets you see things from your customers’ perspective by telling their story with a “When I…I Want To…So That I …” story structure.
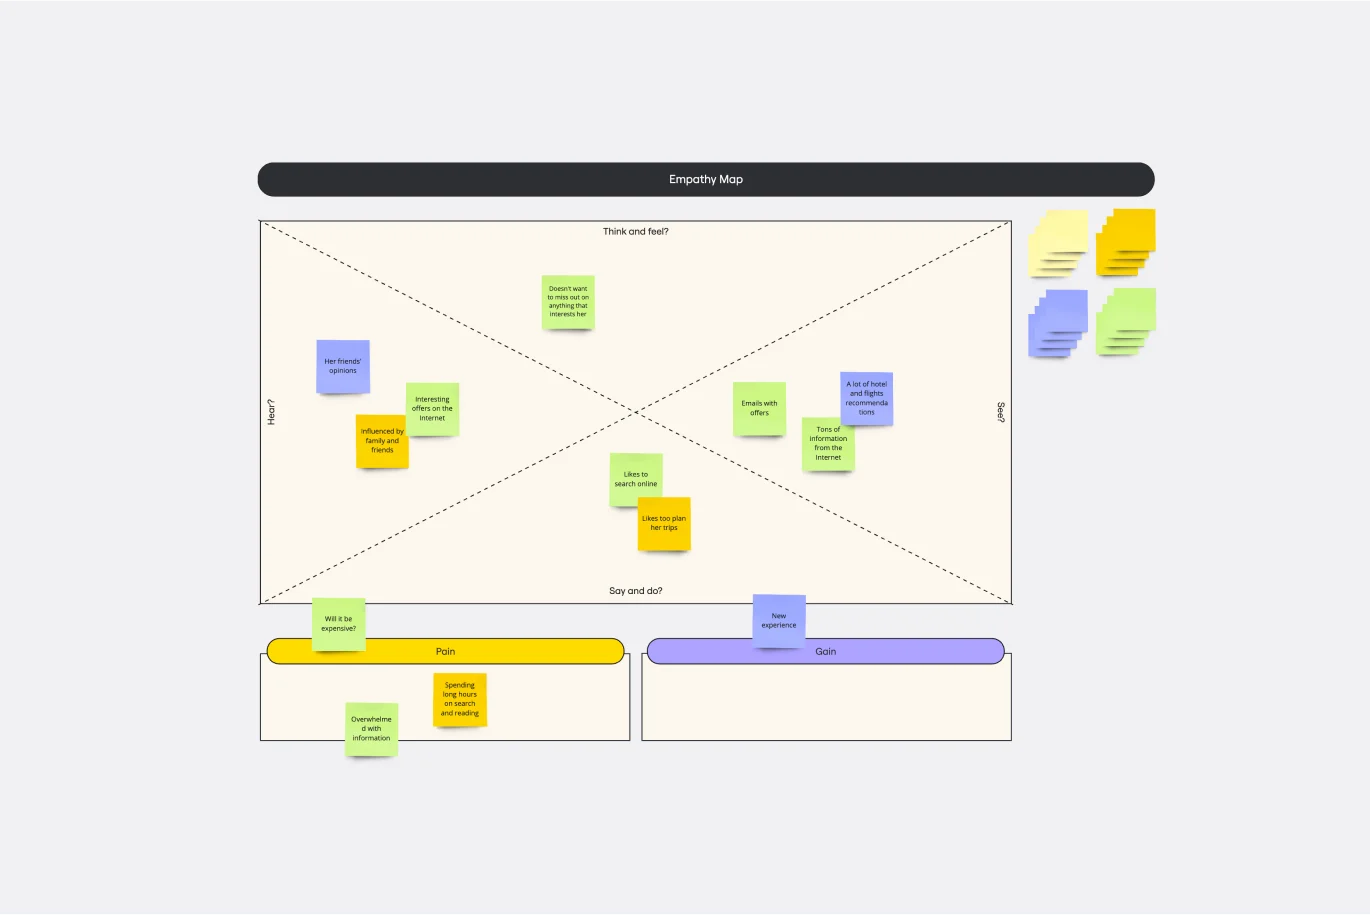
Empathy Map Template
Works best for:
Market Research, User Experience, Mapping
Attracting new users, compelling them to try your product, and turning them into loyal customers—it all starts with understanding them. An empathy map is a tool that leads to that understanding, by giving you space to articulate everything you know about your customers, including their needs, expectations, and decision-making drivers. That way you’ll be able to challenge your assumptions and identify the gaps in your knowledge. Our template lets you easily create an empathy map divided into four key squares—what your customers Say, Think, Do, and Feel.