Driver Diagram Template
Easily map out your objectives and break them into actionable components using the driver diagram template.
Trusted by 65M+ users and leading companies


About the Driver Diagram Template
Add structure to projects using the driver diagram template to simplify complex objectives into understandable parts, ensuring a streamlined approach to achieving goals.
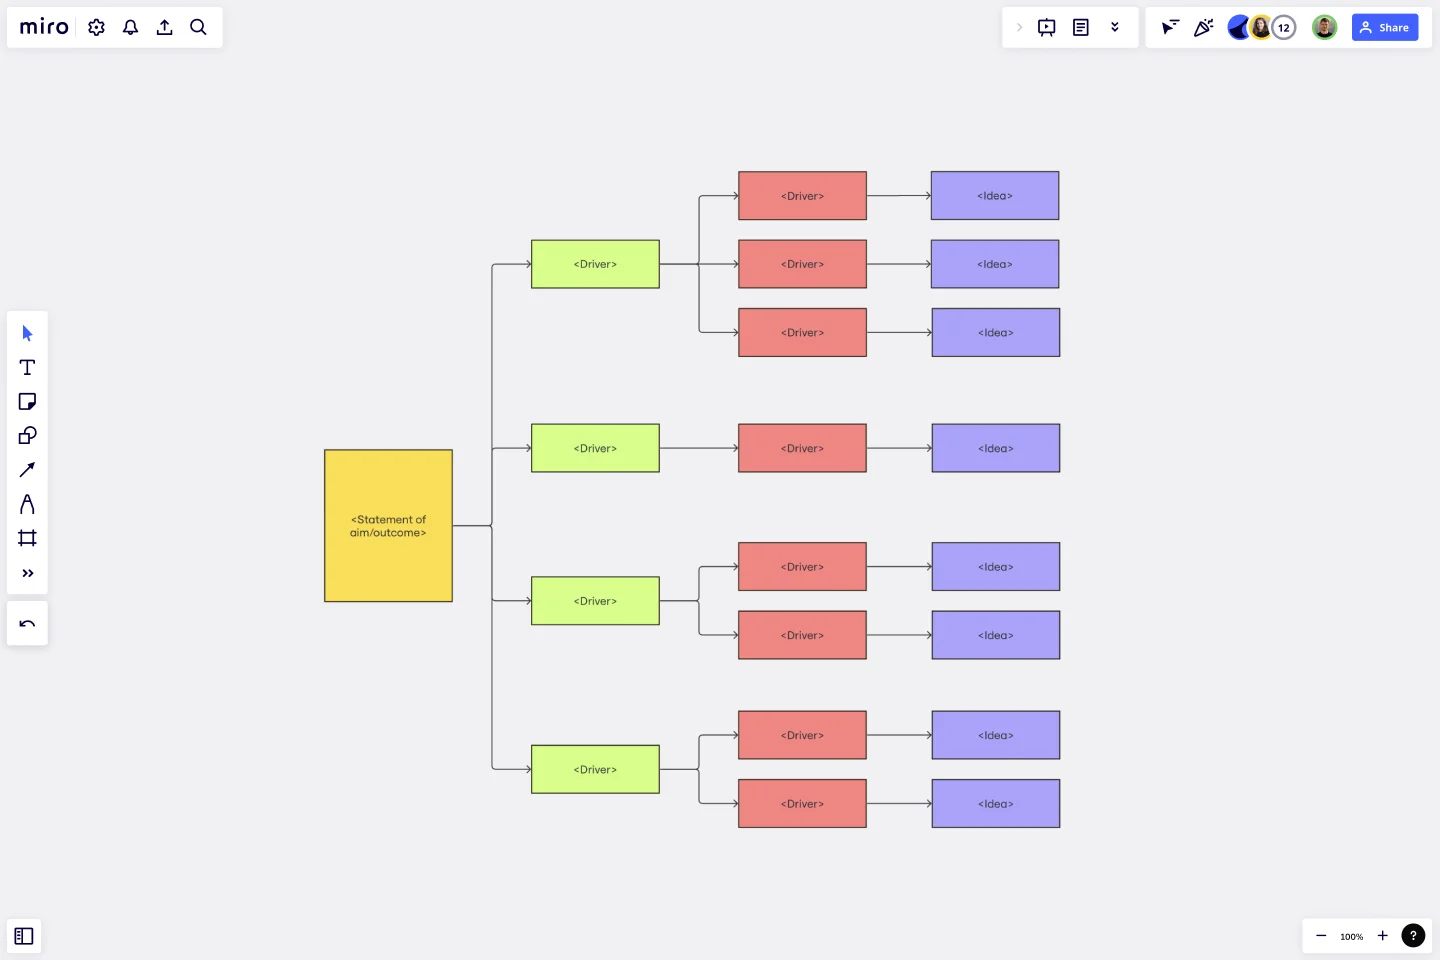
A driver diagram is a strategic visualization tool that delineates a main goal into its core contributors and actionable steps. Use this template to visualize and communicate the key drivers or factors that contribute to achieving a specific goal or outcome.
The template consists of three main areas:
Statement of aim/outcome: This is the heart of the diagram, indicating the ultimate objective or desired result.
Primary drivers: Directly stemming from the aim, these represent integral strategies or areas that are pivotal to achieving the overarching outcome.
Ideas: Branching out from each driver, these signify specific actions or initiatives that support the fulfillment of their respective drivers.
How to use the driver diagram template
The driver diagram template can be used to foster a shared understanding among team members, guide improvement efforts, and provide a structured approach to problem-solving and goal achievement. Here’s how to fill in the template to make it your own:
Add your primary aim: Starting with the "Statement of Aim/Outcome," define the primary goal or outcome that you want to achieve. This could be a desired improvement in a process, customer satisfaction, or any other measurable objective.
Expand your diagram: Edit the shapes and lines to add more drivers and connectors. Include secondary aims or sub-goals that are related to the primary aim. These secondary aims help break down the larger goal into more manageable components. Continue expanding the diagram to include drivers that directly impact the achievement of the secondary aims and, ultimately, the primary aim. Use arrows to indicate the relationships between different elements in the diagram.
Embed additional elements: Elevate the diagram by incorporating other elements, such as notes or reference images, to provide deeper context.
Why should you use a driver diagram template?
By visually representing the drivers and relationships, teams can better prioritize their efforts and focus on the most critical factors for success. Here are a few benefits the driver diagram template provides:
Visualization: Understand and define the cascade from overarching goals to specific actions.
Structured approach: Facilitate methodical planning by breaking down the goal into actionable steps.
Team collaboration: Encourage consistent understanding and teamwork towards a unified objective.
Efficient allocation: Allow for precise resource and time allocation based on priority and impact.
Track & refine: Filling in the driver diagram template makes monitoring progress and making necessary adjustments simpler.
If you'd prefer to start from scratch, diagramming with Miro is easy! You can choose from a wide range of diagramming shapes in Miro's extensive library, so you'll find just what you need.
Can I add more levels of ideas or drivers to the template?
Yes, the template is flexible and can be expanded to include additional layers or branches as your project needs.
How do I make the diagram more interactive?
Once you’ve added the driver diagram template to your Miro board, you have the option to add clickable links, annotations, and other interactive elements to enrich the user experience.
Can I color-code differently than what's shown?
Absolutely. The colors are customizable, allowing you to adapt based on preferences or significance.
Get started with this template right now.
Bubble Map Template
Works best for:
Diagramming, Mapping, Brainstorming
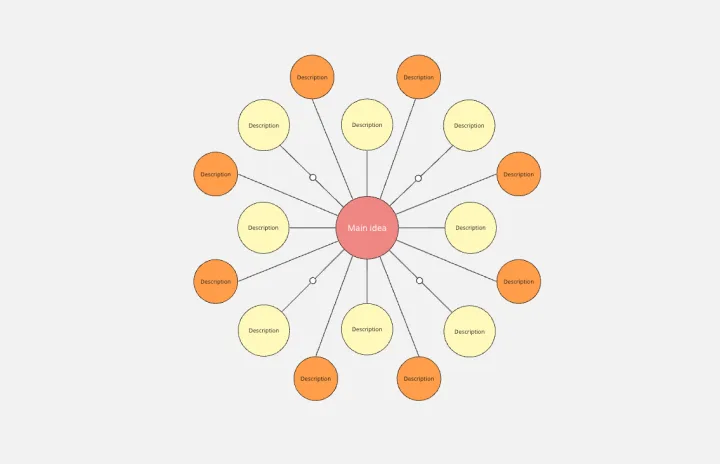
A Bubble Map Template is a visual organization tool that uses bubbles or circles to represent various ideas or data points. These bubbles are linked together, displaying their relationships and creating a network of interconnected thoughts. Use a Bubble Map Template to streamline complex information, enhancing comprehension and promoting efficient decision-making.
Cluster Diagram Template
Works best for:
Diagramming
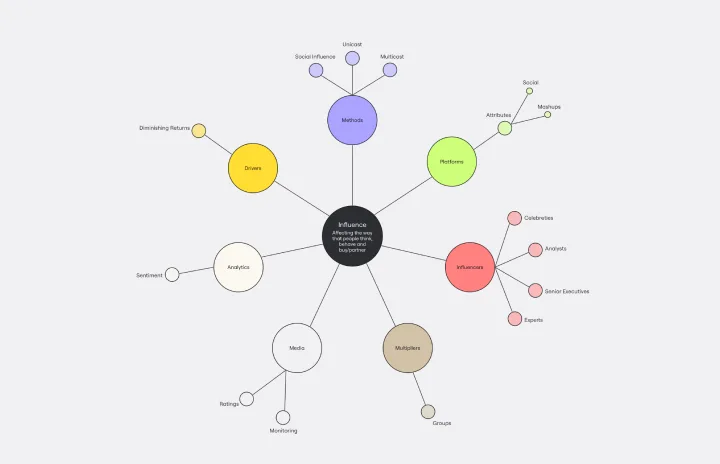
The Cluster Diagram Template is a valuable tool for organizing and connecting ideas, concepts, and information in a visually compelling and coherent manner. The template's design centers on grouping related ideas around a core concept, creating a transparent and hierarchical structure. This clustering not only aids in breaking down complex information into manageable segments but also significantly enhances the process of idea generation and brainstorming. A structured yet flexible visual framework encourages deeper engagement and more precise understanding, making it an essential asset for teams and people looking to bring order to their creative and analytical processes. I have checked the text for any potential spelling, grammar, and punctuation errors, and it's good to go.
Google Cloud Architecture Diagram Template
Works best for:
Software Development, Diagrams
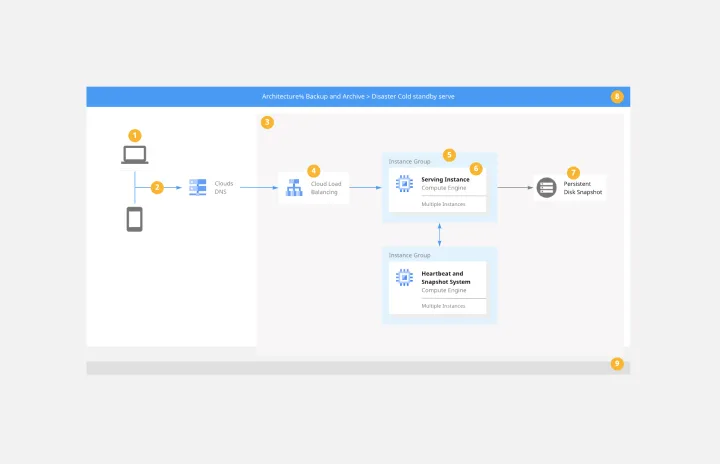
Use the Google Cloud Architecture Diagram template to clearly visualize the deployment of your application and allow you and your team to optimize processes. The GCP template gives you a great overview of your application architecture, and it helps you to iterate quickly and better manage your application development, deployment, and documentation. Try it out and see if it works for you.
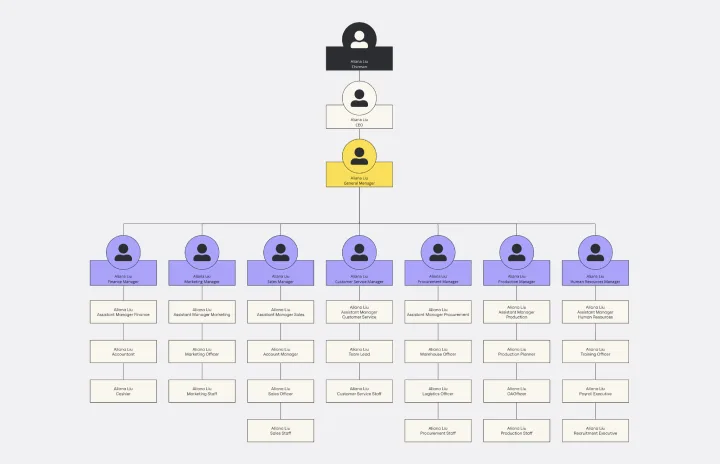
Vertical Organizational Chart
Works best for:
Diagramming, Organizational Charts, Organizational Design
The Vertical Organizational Chart Template is an efficient way to illustrate the hierarchy of an entity in a top-down format. This tool helps represent roles and relationships in a clear manner, starting from the topmost authority and branching downwards. It allows for a better understanding of the flow of responsibilities and communication channels within the organization. One of its most significant advantages is promoting clear communication. Depicting the organization's structure helps avoid misunderstandings and ensures everyone is on the same page regarding the chain of command.

Azure Demand Forecasting Template
Works best for:
Software Development, Diagrams
The Azure Demand Forecasting diagram will show the architecture of a demand forecast, making it easier for you to predict data consumption, costs, and forecast results. Azure is Microsoft’s cloud computing platform, designed to provide cloud-based services such as remote storage, database hosting, and centralized account management. Azure also offers new capabilities like AI and the Internet of Things (IoT).
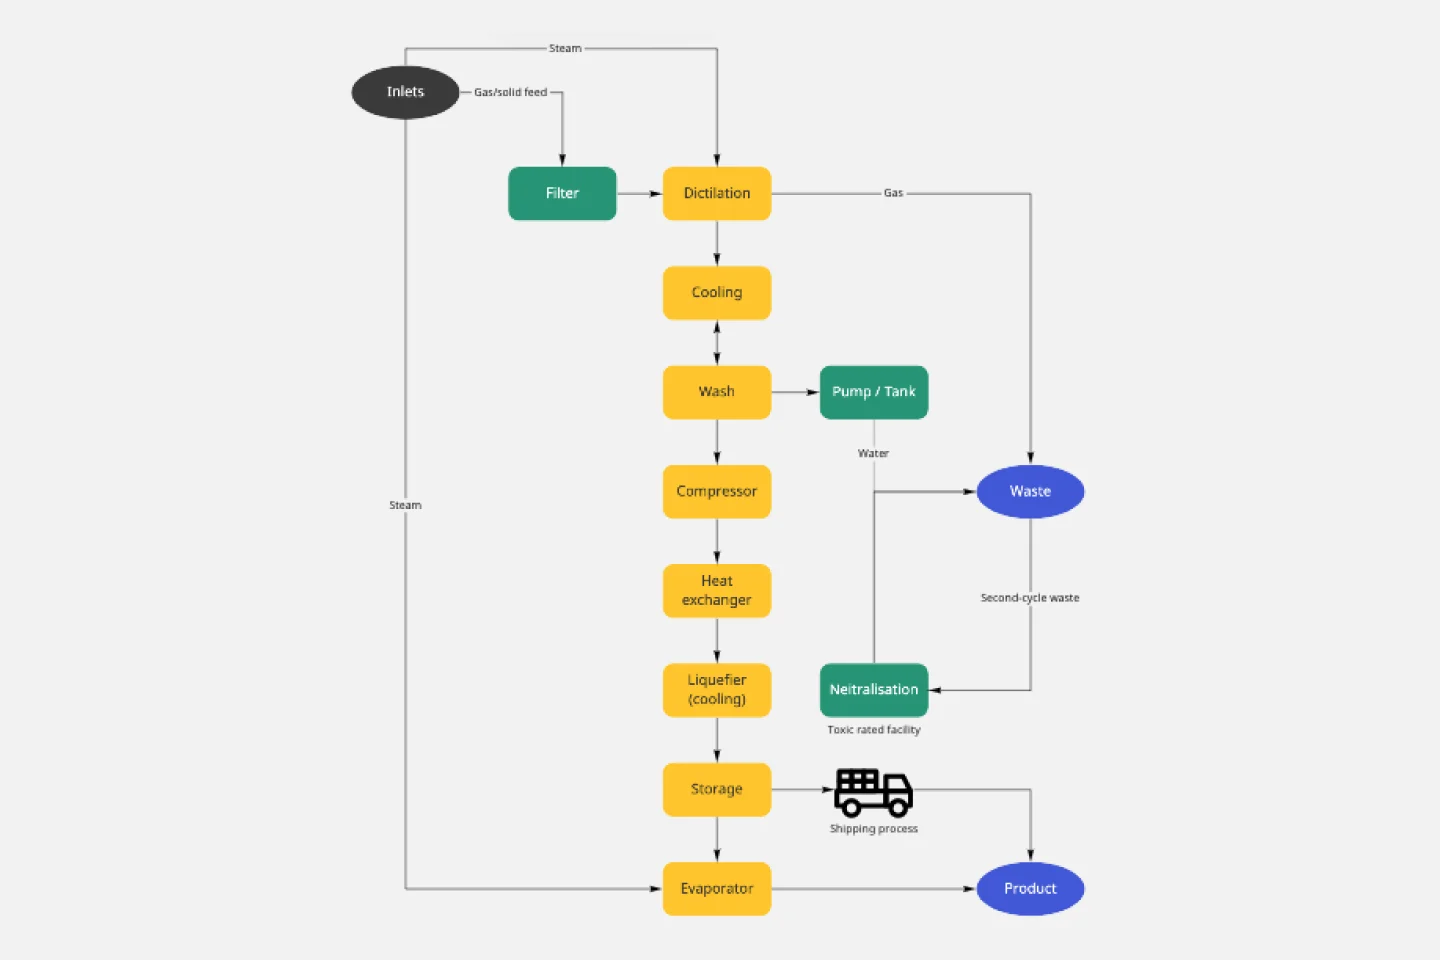
Block Diagram Template
Works best for:
Mapping, Software Development, Diagrams
Use this template to illustrate technical systems. Blocks represent important objects in the system, and arrows demonstrate how the objects relate to each other. Perfect for engineers, workflow managers, or anyone trying to build a better process.