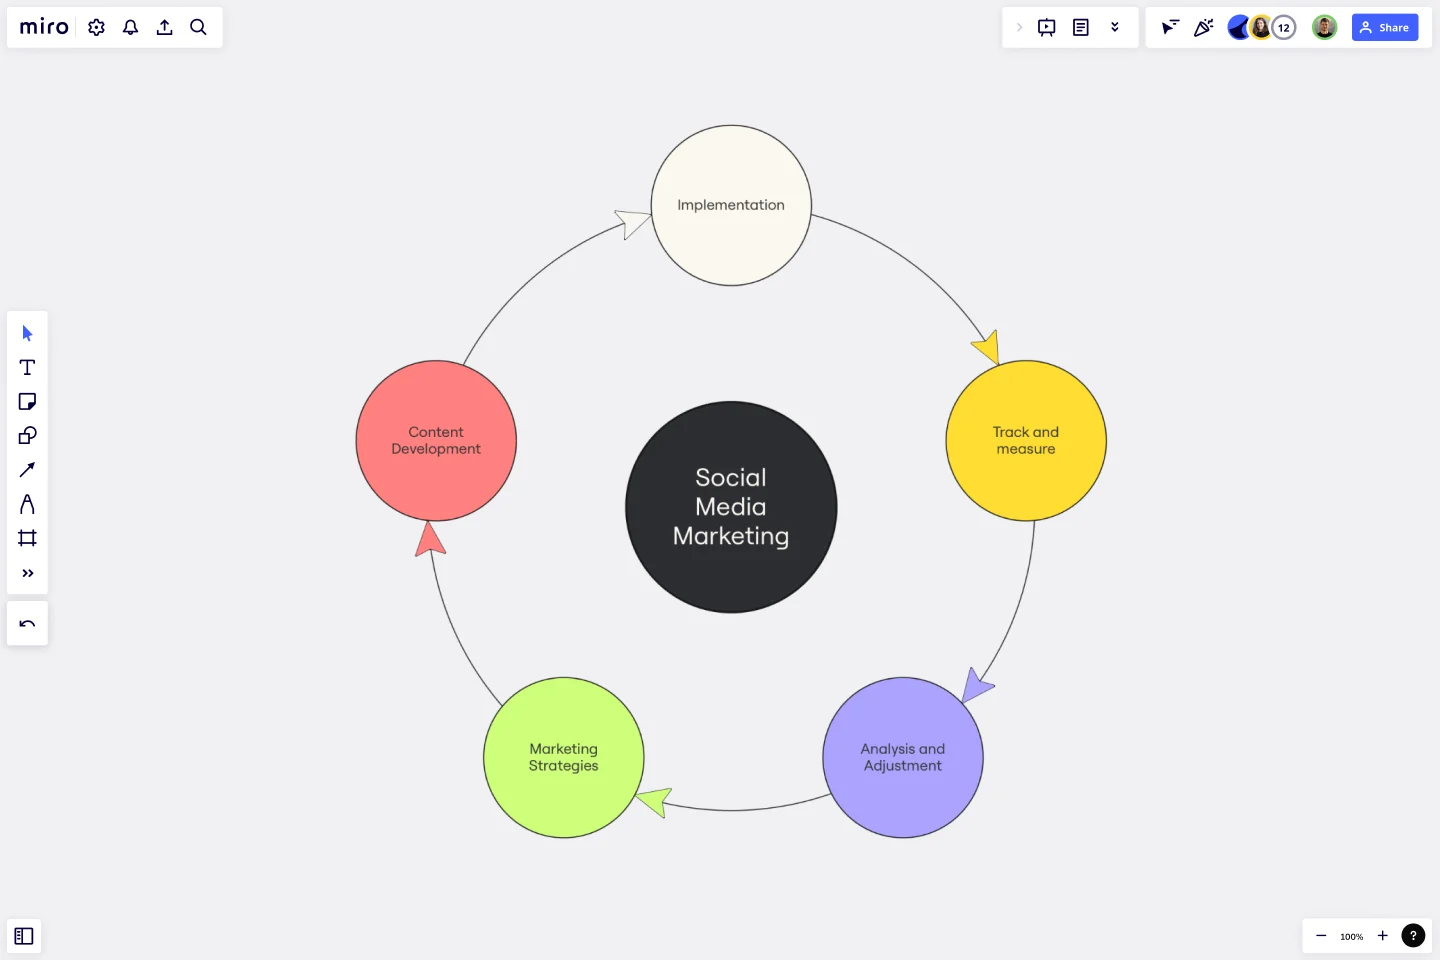
Cycle Diagram Template
Effortlessly represent complex cycles, enhance presentations, and collaborate seamlessly using the cycle diagram template.
Trusted by 65M+ users and leading companies


About the Cycle Diagram Template
The cycle diagram template helps you streamline visual communication by mapping project cycles, illustrating process flows, or visualizing interconnected concepts. With this template, you can create compelling and insightful diagrams that will help you communicate your ideas more effectively.
Understanding the cycle diagram template
Cycle diagrams are a great way to visually represent processes, relationships, or events in an organized manner. They provide a structure that easily depicts the continuous flow and interdependence of elements within a system. You can simplify complex concepts using cycle diagrams, making it an invaluable asset for anyone seeking clarity in their visual storytelling.
How to use the cycle diagram template in Miro
Customize with ease: Effortlessly edit the template by adding, removing, or rearranging elements with just a few clicks.
Automated diagramming: Leverage Miro's automated diagram maker to expand and enhance your cycle diagram. Connect elements seamlessly, allowing the diagram to evolve dynamically as your ideas take shape.
Contextual artifacts: Elevate your diagram by incorporating additional artifacts from your Miro board. Whether it's notes, images, or data, provide context that enriches the understanding of your audience.
Why should you use a cycle diagram template?
Clarity and understanding: The template promotes clarity, enabling you to communicate complex processes with simplicity.
Efficiency in visualization: Quickly map out cyclical relationships and processes, saving time and effort in creating visually impactful diagrams.
Collaborative advantage: Enhance collaboration by creating a shared visual language that fosters clear communication among team members.
Versatility: The template adapts to various contexts, making it suitable for project management, strategic planning, or educational purposes.
Professional Presentation: Elevate your presentations and reports with professionally crafted cycle diagrams that resonate with your audience.
Can I change the colors and styles of the cycle diagram template?
Achieve your desired look by customizing the template with ease. Adjust colors, fonts, and styles by selecting shapes and editing in the context menu bar.
Can I export the cycle diagram to other formats?
Yes, Miro allows you to export your cycle diagram in various formats, ensuring compatibility with your preferred tools and platforms.
Get started with this template right now.
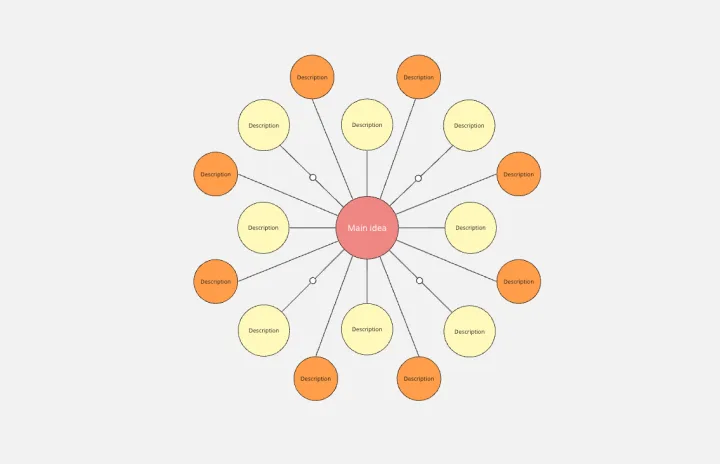
Web Diagram Template
Miro's Web Diagram Template simplifies complex project organization and promotes effective communication. It allows users to easily connect elements and gain a comprehensive understanding of complex relationships, making it a versatile and invaluable asset for diverse projects.
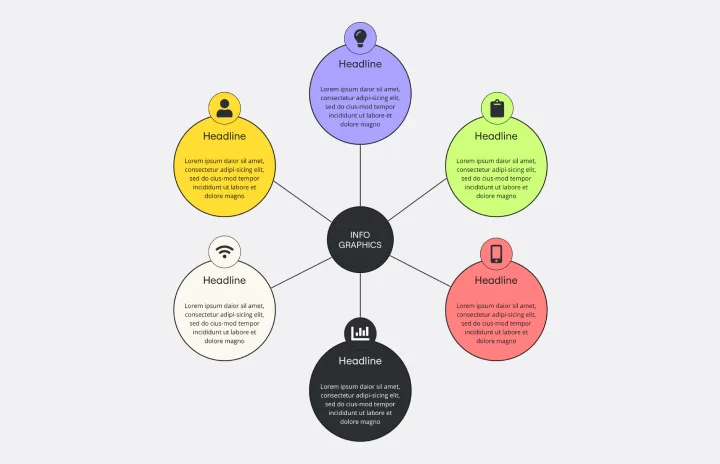
Bubble Map Template
Works best for:
Diagramming, Mapping, Brainstorming
A Bubble Map Template is a visual organization tool that uses bubbles or circles to represent various ideas or data points. These bubbles are linked together, displaying their relationships and creating a network of interconnected thoughts. Use a Bubble Map Template to streamline complex information, enhancing comprehension and promoting efficient decision-making.
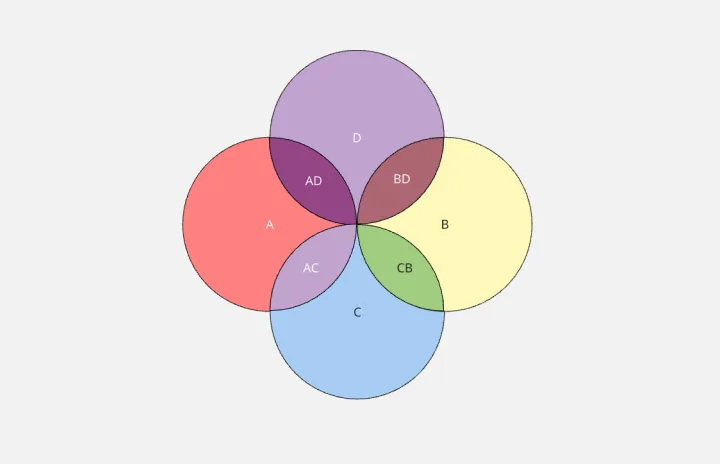
4-Circle Venn Diagram Template
Works best for:
Diagramming, Mapping, Brainstorming
The 4-Circle Venn Diagram Template has an easy, interactive, and dynamic way to visualize complex relationships between data sets. Empower your team's collaboration and communication with this powerful tool.

Login Sequence Diagram Template
Works best for:
Diagramming, Technical Diagramming
The UML Sequence Login Diagram Template is a valuable tool for visualizing user authentication processes. It breaks down complex login sequences into clear, visual components, facilitating collaborative understanding among team members, regardless of their technical expertise. This shared understanding is crucial for ensuring all stakeholders, from developers to project managers, are on the same page, leading to efficient decision-making and a smoother development process. The template's ability to translate technical details into an accessible format streamlines communication and significantly reduces the likelihood of misinterpretation or oversight, making it an essential asset in any software development project.
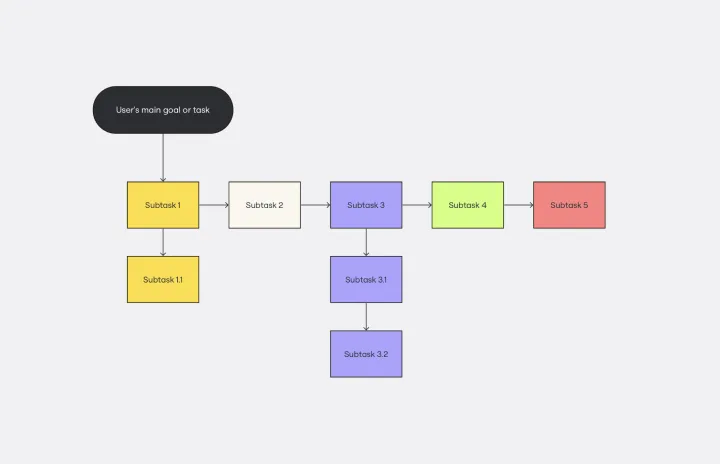
Task Analysis Diagram Template
Works best for:
Diagramming
The Task Analysis Diagram Template is a helpful tool that simplifies complex tasks by breaking them down into smaller, more manageable steps. This strategic approach brings clarity and ensures a systematic method for tackling complex user paths. The template's most significant advantage is its precision, as it maps out every detail of a task to guarantee that nothing is missed. This results in more efficient operations.
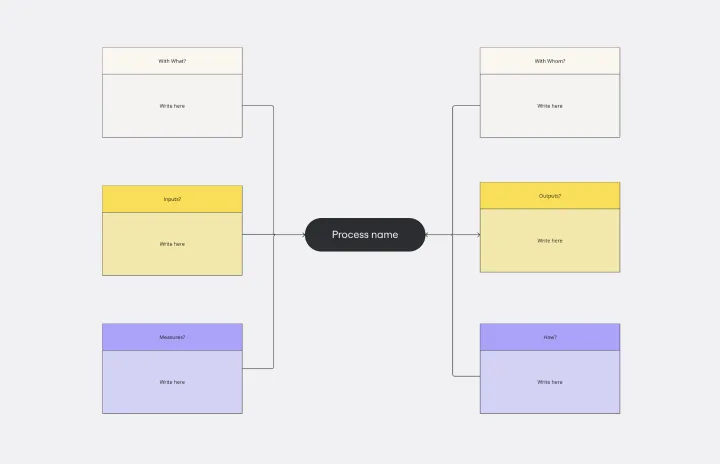
Turtle Diagram Template
Works best for:
Diagramming
The Turtle Diagram Template is an essential tool for capturing the essence of a process. It offers many benefits, but one stands out: it fosters clear and comprehensive communication within teams. By breaking down processes into digestible components, the template creates a common ground for discussion. It helps team members unfamiliar with certain processes or from different departments collaborate effectively by ensuring everyone's on the same page about the inputs, outputs, roles, resources, and procedures. This is crucial for organizations that aim to maintain coherence in quality management practices and drive collective efforts toward operational excellence.