Current State vs. Future State Flowchart Template
Strategically allocate tasks, visualize process changes, and identify bottlenecks with the current state vs. future state flowchart template.
Trusted by 65M+ users and leading companies


About the Current State vs. Future State Flowchart Template
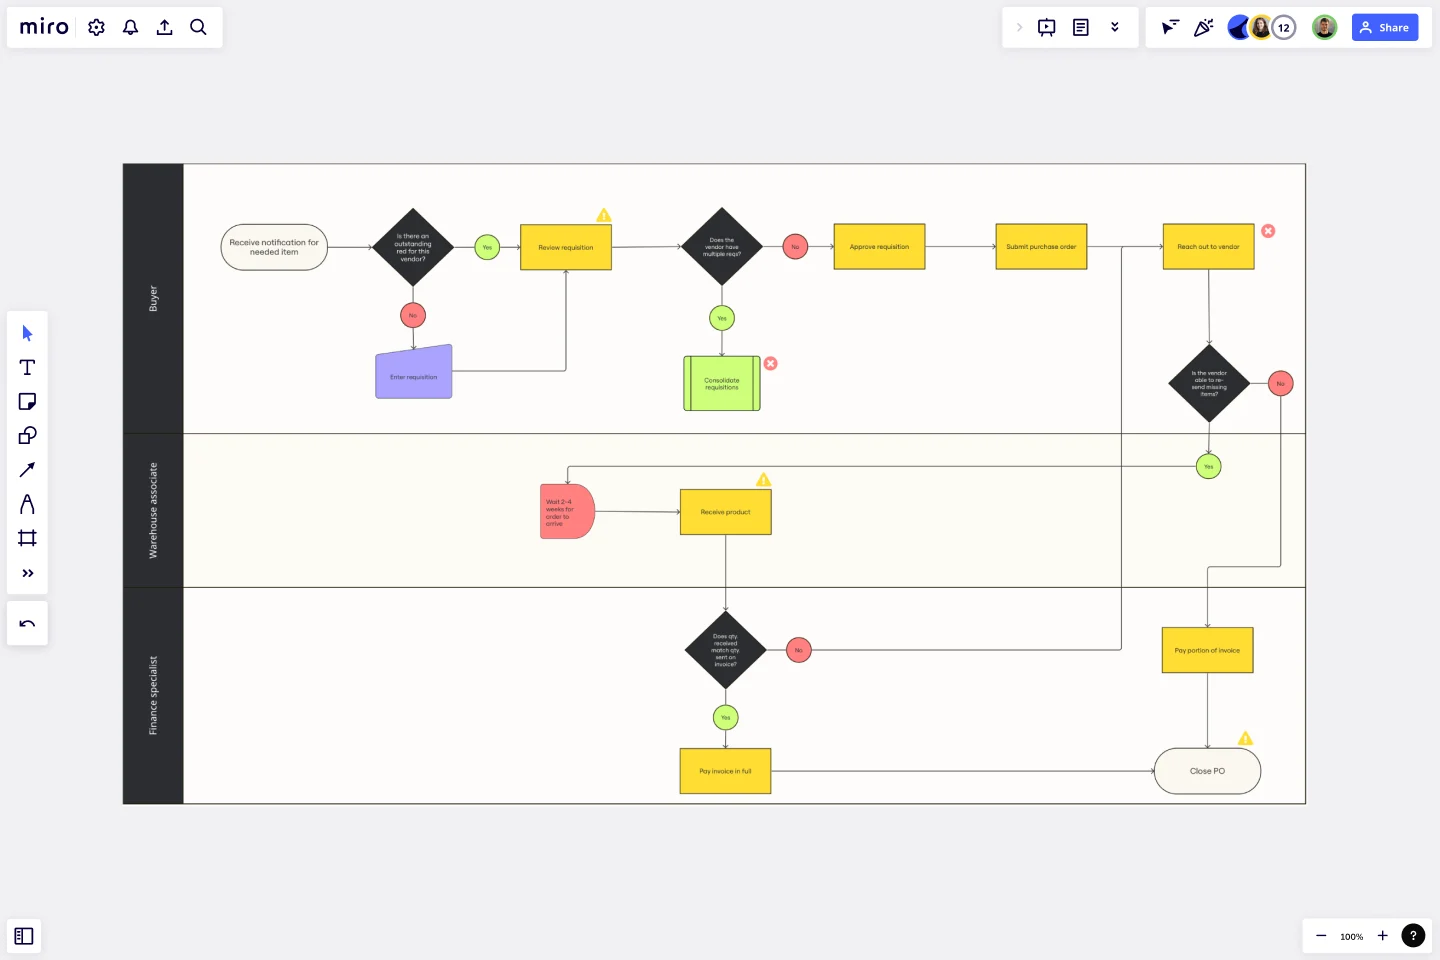
The Current State vs Future State Flowchart Template is essential for teams facing complex processes. This powerful asset provides clarity and structure to workflows, employing swimlanes to clarify departmental responsibilities and layers to offer a nuanced view of process changes. With its strategic guidance, teams can identify and address bottlenecks with precision, empowering them to navigate their transformational journey with confidence and ease. Don't let complex processes slow you down - use the Current State vs Future State Flowchart Template to take control.
Understanding the template
The Current State vs Future State Flowchart Template is designed to allocate tasks to respective departments using swimlanes, which helps to define roles and responsibilities clearly. The template also has layers that allow for dynamic representation of changes between the current and future states. This tool goes beyond just visualizing the process, as it can help teams identify bottlenecks and improve efficiency by streamlining workflows.
How to use the current state vs. future state flowchart template in Miro
Optimize task allocation with swimlanes: Use swimlanes to assign tasks to specific departments, fostering transparency in responsibilities and facilitating streamlined communication.
Enhance visualization with layers: Leverage layers to dynamically represent changes between current and future processes, offering a detailed and adaptable perspective on the transformation journey.
Proactively address bottlenecks: Analyze the flowchart to identify bottlenecks, providing teams with actionable insights to address challenges and optimize workflow efficiency proactively.
Why should you use a current state vs. future state flowchart template?
Precision with swimlanes: Clearly understand and communicate which department is responsible for each task, ensuring accountability and clarity within the team.
Nuanced process visualization: Employ layers to visualize complex changes between current and future processes, offering a comprehensive and adaptable representation of the transformational journey.
Identify bottlenecks: The template serves as a strategic tool, enabling teams to address challenges and optimize workflow efficiency strategically.
Transparent communication: Use swimlanes to precisely define responsibilities, promoting transparent communication and alignment on tasks and objectives.
Efficiency optimization: Pinpointing bottlenecks empowers teams to optimize workflows, enhancing overall efficiency and effectiveness.
If you'd prefer to start from scratch, flowcharting with Miro is easy! You can choose from a wide range of flowchart shapes in Miro's extensive library, so you'll find just what you need.
Can I export the flowchart for external use or presentations?
Miro provides export options, allowing you to save your flowchart as an image or PDF for external sharing or adding to presentations.
Are there any pre-built templates for specific industries or processes?
While the Current State vs Future State Flowchart Template provides a versatile framework, Miro also offers industry-specific templates that can be customized to meet your unique needs.
Get started with this template right now.
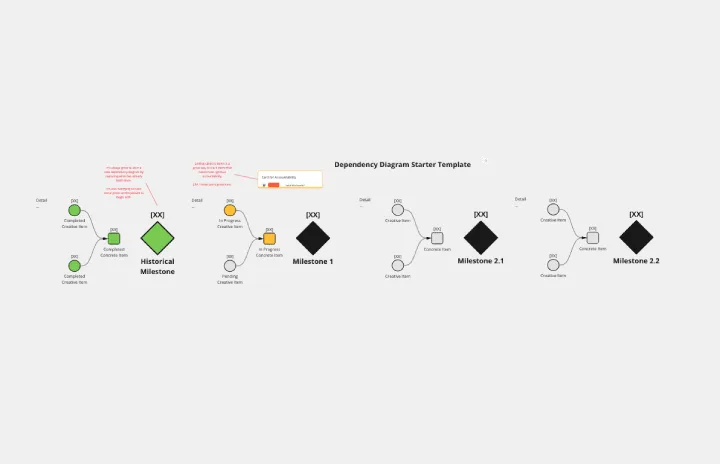
Dependency Diagrams Educational Board
Works best for:
Diagramming
The Dependency Diagrams Educational Board template provides a visual tool for teaching and learning about dependency relationships between components in systems. It offers a structured framework for illustrating dependencies, connections, and interactions within a system or process. This template enables educators to explain complex concepts effectively and engage learners in interactive activities. By promoting visual learning and understanding of dependencies, Dependency Diagrams empower students to grasp fundamental principles of systems thinking and analysis.
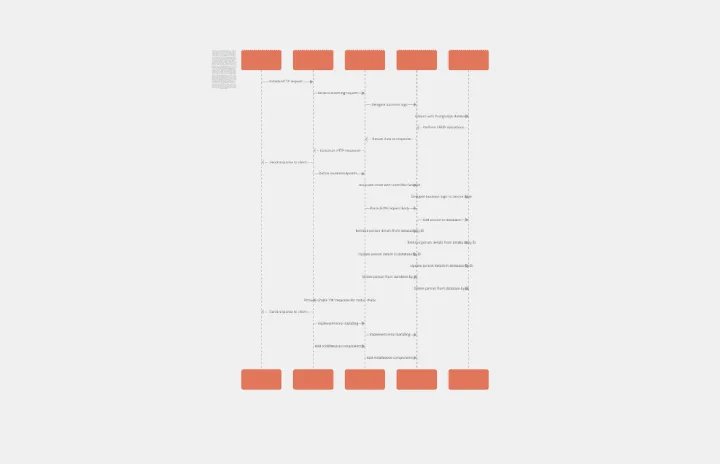
Person Api Uml
Works best for:
Diagramming
The Person Api Uml template offers a visual framework for designing and modeling Person API structures and interactions. It provides elements for defining entities, attributes, and relationships within a Person API system. This template enables teams to visualize and communicate the structure and behavior of Person APIs, facilitating collaboration and alignment among stakeholders. By promoting clarity and consistency in API design, the Person Api Uml template empowers teams to build robust and interoperable Person API solutions.
Value Network Mapping (1.0)
The Value Network Mapping (1.0) template is a visual tool for analyzing and optimizing the relationships and interactions between stakeholders within a network. It provides a structured framework for mapping out value exchanges, dependencies, and opportunities for collaboration. This template enables teams to gain insights into the dynamics of their ecosystem, identify key actors, and align strategies for mutual benefit. By promoting transparency and collaboration, Value Network Mapping empowers organizations to enhance value creation and foster strategic partnerships.
Flowchart Template
Works best for:
Flowcharts, Mapping, Diagrams
Trying to explain a process or workflow to your team — or just wrap your head around it yourself? Sometimes the best way is to see it, and that’s when you create a flowchart. Using common shapes (generally just ovals, rectangles, diamonds, and arrows), a flowchart shows you the direction a process or workflow goes and the order of steps. Beyond giving you a clear understanding, you’ll also be able to see potential flaws and bottlenecks, which helps you refine and improve your process and create a better product more efficiently.

Onion Diagram Template
Works best for:
Diagramming, Mapping and Diagramming
The Onion Diagram Template is a distinct tool designed to visually represent layers of a specific concept, system, or process, akin to the layers of an onion. Each concentric layer of the diagram provides insights into a different aspect or phase of the topic at hand, moving from the core foundational element outwards to more peripheral components. One of the prime benefits of this template is its ability to offer hierarchical clarity. Users can immediately discern the importance, sequence, or interrelation of different elements within a system, facilitating enhanced comprehension and efficient decision-making.

2-Circle Venn Diagram Template
The 2 Circle Venn Diagram Template is a dynamic, intuitive tool designed to represent the logical relationships between two data sets visually. For teams, this template proves valuable in enabling efficient collaboration, clear communication, and shared understanding.