Cladogram Template
Easily explain evolutionary relationships with the Cladogram Template.
Trusted by 65M+ users and leading companies


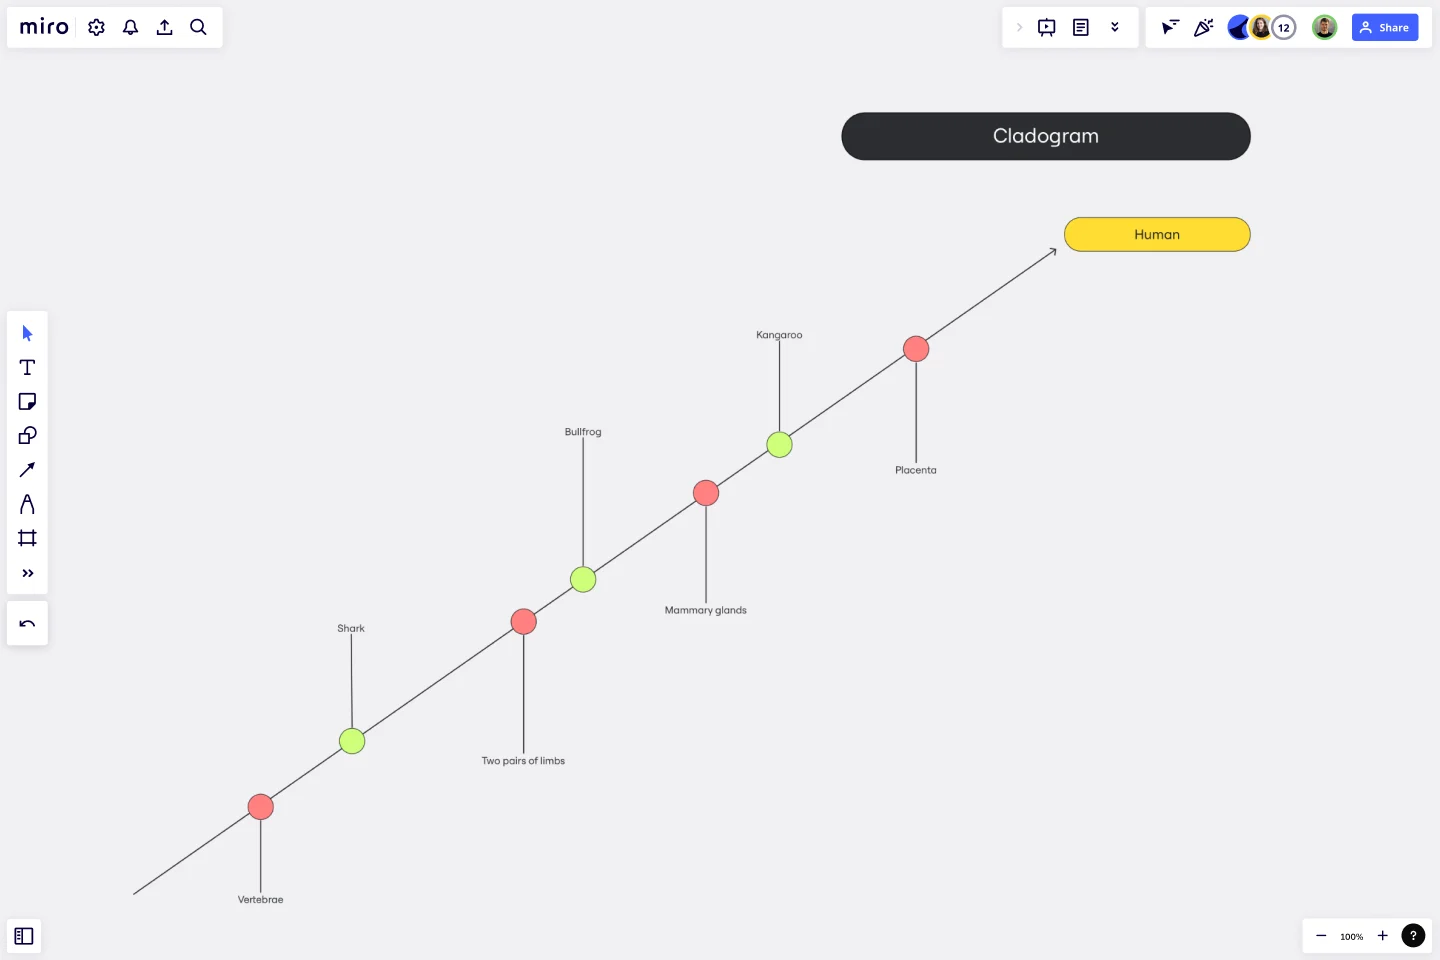
About the Cladogram Template
The Cladogram Template is a helpful visual tool that simplifies the representation of evolutionary relationships among different species or concepts. A cladogram is a branching diagram that displays the connections between various entities based on shared characteristics and evolutionary divergence.
The template enables users to easily create, edit, and expand cladograms. It's a powerful asset for educators, scientists, and professionals who want to simplify complex relationships and showcase evolutionary connections.
How to use the cladogram template in Miro
Customize easily: Edit the template with just a few clicks, tailoring it to your specific requirements. Change labels, change branches, and adjust the structure effortlessly.
Automated diagramming: Leverage Miro's automated diagramming features to expand your cladogram. The platform intelligently adjusts the layout as you add or remove elements, ensuring a visually appealing and logically structured diagram.
Add context: Enhance your cladogram by incorporating artifacts from your Miro board. This could include images, text, or other relevant materials, providing additional context and depth to your evolutionary representation.
Why use a cladogram template?
Simplify complex concepts: Simplify intricate evolutionary relationships and present them in a clear and comprehensible format.
Enhance collaboration: Facilitate team collaboration by visualizing a shared understanding of evolutionary connections.
Save time: Use the template's user-friendly design and automation features, which allow you to focus on content rather than formatting.
Dynamic adaptability: Adapt your cladogram quickly as new information arises or concepts evolve, ensuring that your diagrams remain relevant.
Effective communication: Communicate complex ideas effectively, whether in the classroom, research setting, or professional environment.
Find out all the features of Miro's cladogram maker and start building your diagram right now.
Can I customize the colors and shapes of elements in the cladogram?
Miro's cladogram template allows complete customization, including colors, shapes, and labels, empowering you to create visually appealing and informative diagrams.
Can I export the cladogram created in Miro to other file formats?
Yes, Miro supports various export formats, ensuring that your cladogram can be shared in multiple ways, such as PDFs or images.
Get started with this template right now.
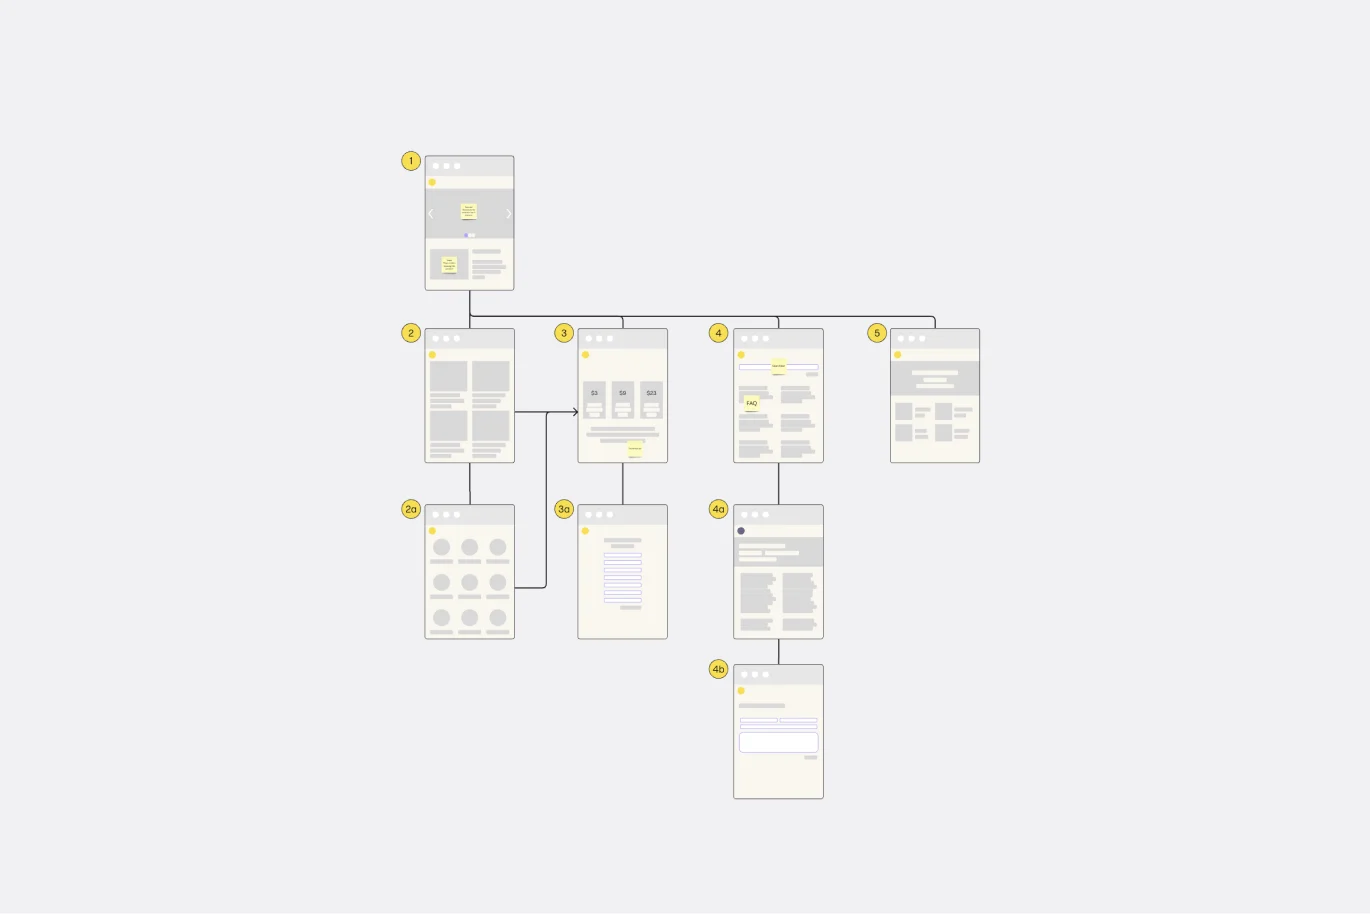
Website Flowchart Template
Works best for:
Flowcharts, Mapping, User Experience
A website flowchart, also known as a sitemap, maps out the structure and complexity of any current or future website. The flowchart can also help your team identify knowledge gaps for future content. When you’re building a website, you want to ensure that each piece of content gives users accurate research results based on keywords associated with your web content. Product, UX, and content teams can use flowcharts or sitemaps to understand everything contained in a website, and plan to add or restructure content to improve a website’s user experience.
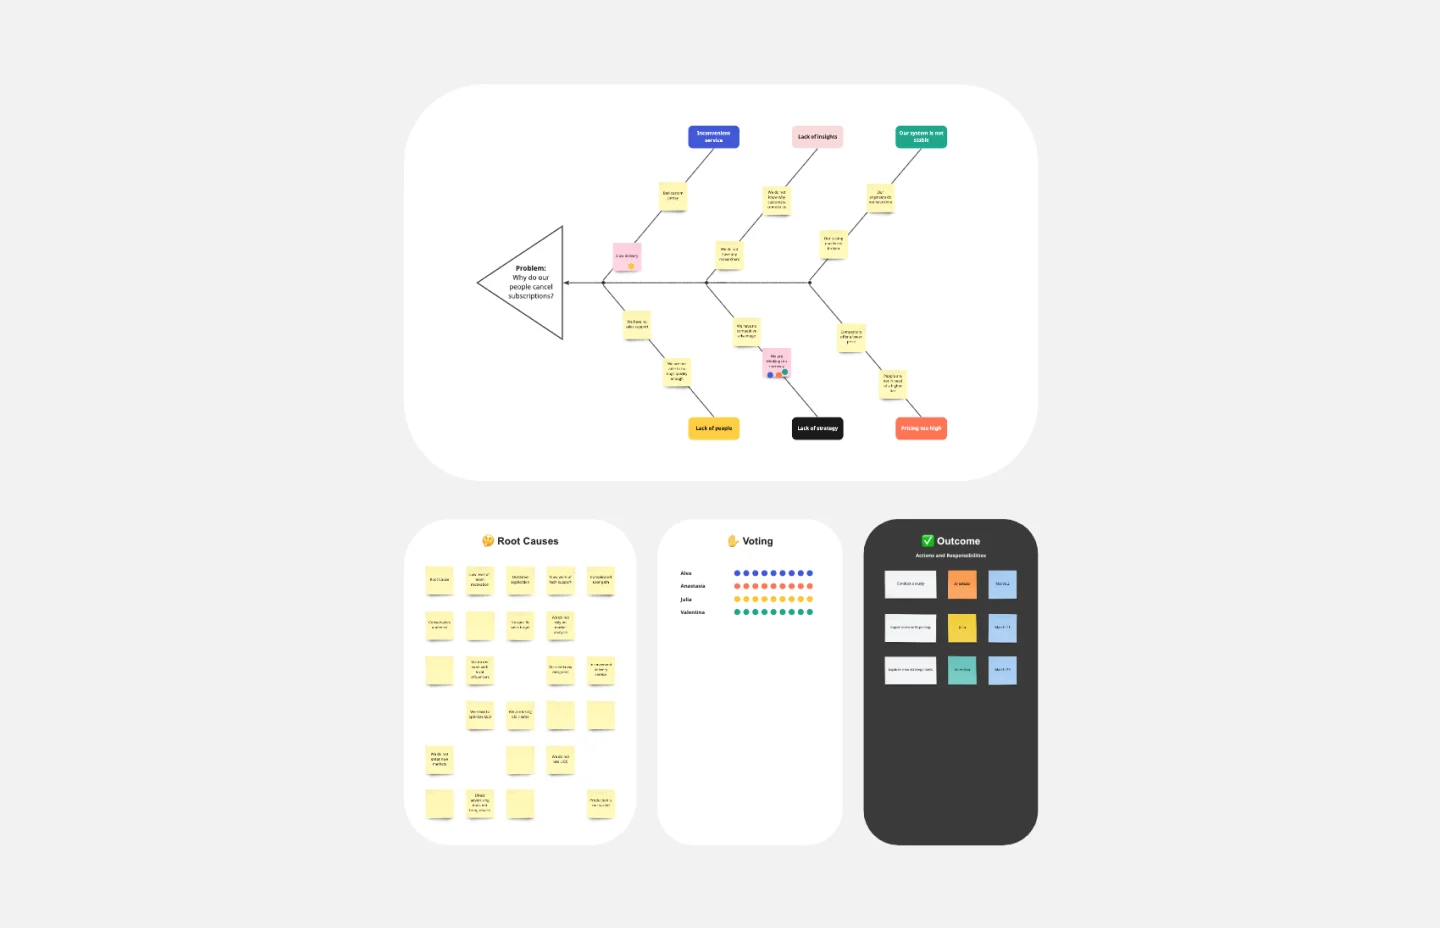
Fishbone Diagram Template
Works best for:
Operations, Diagrams, Workflows
What is the best way to solve any problem your team faces? Go straight to the root. That means identifying the root causes of the problem, and fishbone diagrams are designed to help you do it best. Also known as the Ishikawa Diagram (named after Japanese quality control expert Kaoru Ishikawa), fishbone diagrams allow teams to visualize all possible causes of a problem, to explore and understand how they fit together holistically. Teams can also use fishbone diagrams as a starting point for thinking about what the root cause of a future problem might be.
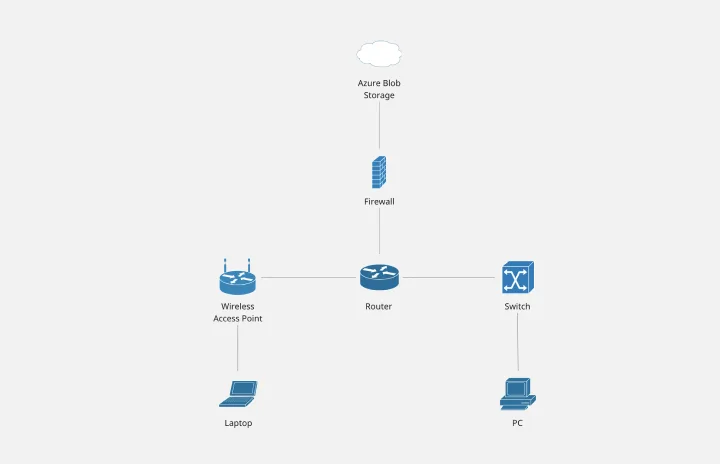
Cisco Network Diagram Template
Works best for:
Software Development, Diagrams
Cisco offers data center and access networking solutions built for scale with industry-leading automation, programmability, and real-time visibility. The Cisco Data Network Diagram uses Cisco elements to show the network design of Cisco Data Networks visually.
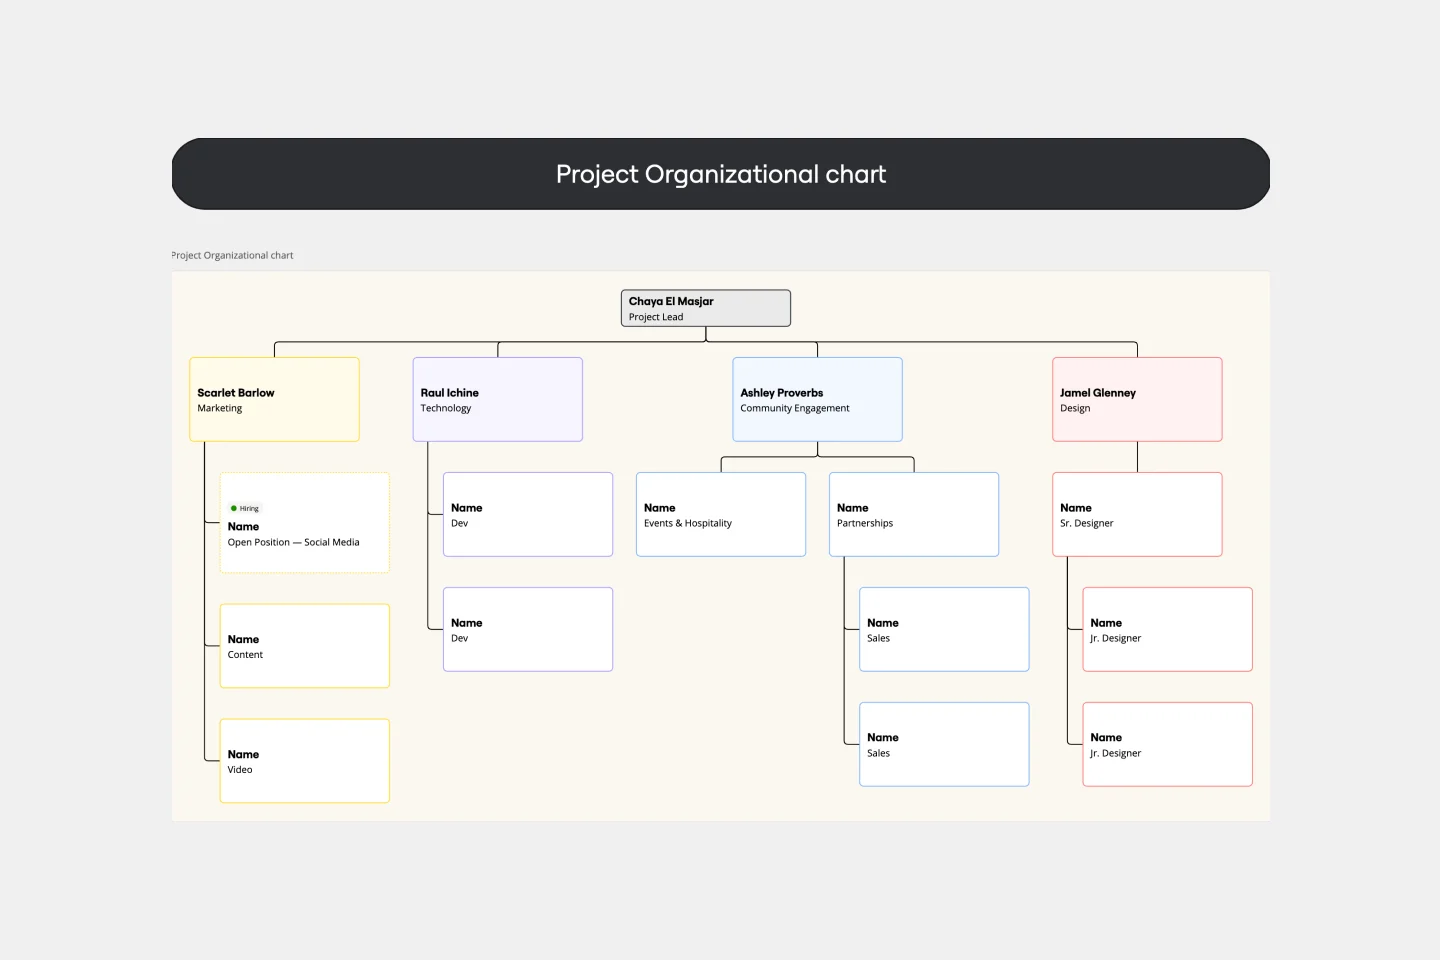
Project Organizational Chart Template
Works best for:
Project Management, Documentation, Org Charts
When you’re embarking on a long, complex project, you will inevitably hit roadblocks and obstacles. It’s important to have your project organizational chart on hand to overcome those challenges. A project organizational chart is a visual diagram that illustrates who is on your team and the role they play in a given project. It documents the structure of the project organization, the hierarchy between team members, and the relationships between employees. Project organizational charts are useful tools for clarifying who does what, securing buy-in, and setting expectations for the group.
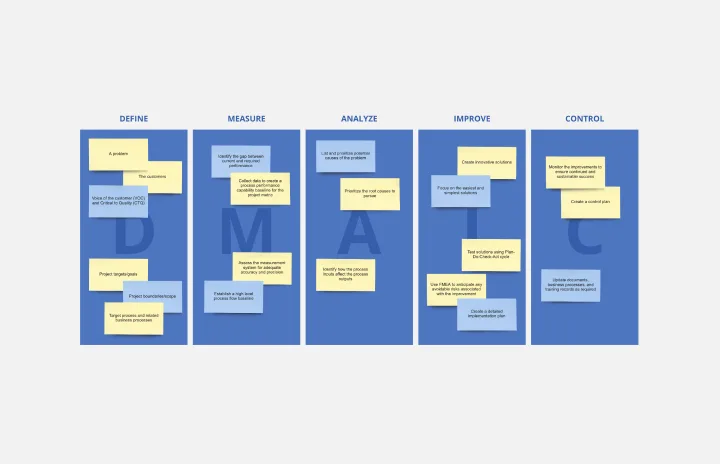
DMAIC Analysis Template
Works best for:
Agile Methodology, Design Thinking, Operations
Processes might not seem like the funnest thing to dive into and examine, but wow can it pay off—a more efficient process can lead to serious cost savings and a better product. That’s what DMAIC analysis does. Developed as part of the Six Sigma initiative, DMAIC is a data-driven quality strategy for streamlining processes and resolving issues. The technique is broken into five fundamental steps that are followed in order: Define, Measure, Analyze, Improve, and Control.
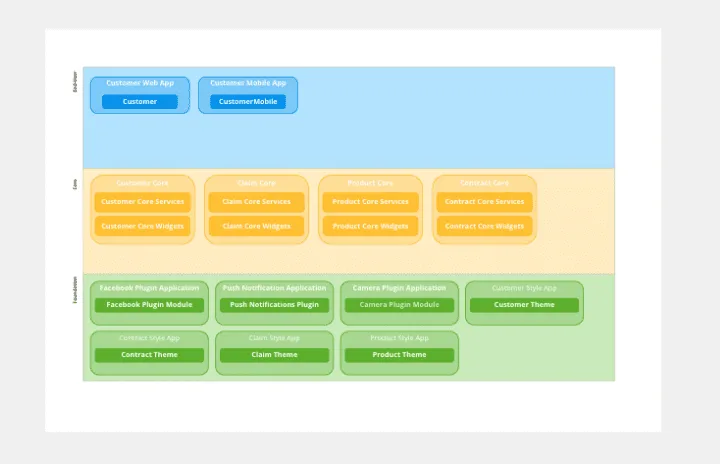
OutSystems Architecture Diagram
Works best for:
Diagramming
The OutSystems Architecture Diagram template offers a visual tool for designing and documenting software architectures using the OutSystems platform. It provides elements for modeling application components, data structures, and integration points. This template enables teams to visualize and communicate the architecture of their OutSystems applications, facilitating collaboration and alignment among developers and stakeholders. By promoting clarity and understanding of system architecture, the OutSystems Architecture Diagram empowers teams to build scalable, maintainable, and high-performance applications effectively.