CI/CD Pipeline Diagram Template
Build a deployment pipeline and manage delivery easily with the CI/CD diagram template.
Trusted by 65M+ users and leading companies


About the CI/CD Diagram Template
Efficiency and reliability are crucial in software development, and the CI/CD template helps achieve both. It is a visual guide that facilitates the integration of Continuous Integration and Continuous Delivery practices into project management. The template streamlines the development process from writing code to deploying it to production.
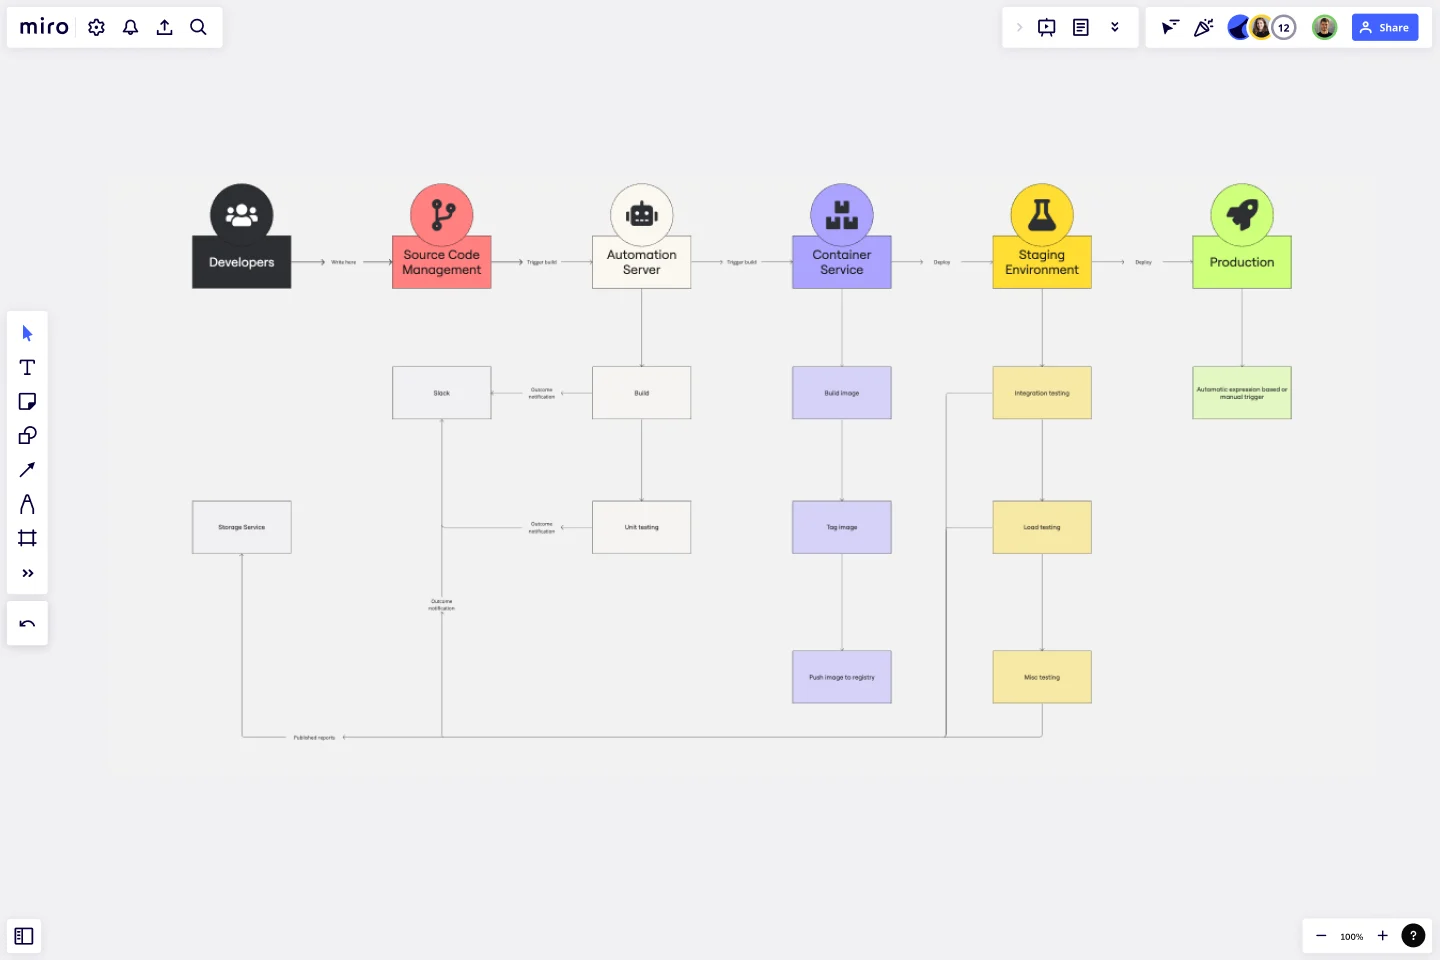
This diagram outlines each phase of the CI/CD pipeline. It provides a clear structure for the sequence of events in the automation process, including code commits, unit tests, integration tests, and deployment. Each stage has designated areas where users can plot specific actions, such as automated builds or deployment schedules. By interacting with each segment, one can trace the path from code conception to delivery, ensuring transparency and manageability at every process step.
Each area in the template not only defines a specific stage in the CI/CD process but also serves as a conduit for collaboration, allowing team members to assign tasks, share updates, and maintain the integrity and continuity of the software delivery pipeline.
Source Code Management:
Repository for maintaining code versions and history (e.g., Git repositories).
Integration with hooks/triggers to notify the CI/CD pipeline of changes.
Branching strategies and merge policies are documented here.
Access control and review process for code contributions are outlined.
Automation Server:
Central system that orchestrates the build process and executes the pipeline.
Manages task scheduling, executes automated tests, and reports outcomes.
Configurations for building jobs and dependencies between them are handled here.
Often includes a dashboard or interface for monitoring build statuses and history.
Container Server:
Infrastructure for running and managing containers (e.g., Docker, Kubernetes).
Details containerization of the application for consistent deployment environments.
Describes image repositories and management for versioning of containerized services.
Specifies orchestration requirements, scaling policies, and health checks.
Staging Environment:
A mirror of the production environment used for final testing before release.
Deployment strategies such as blue-green deployments or canary releases are outlined.
Performance testing, security scanning, and user acceptance testing criteria are specified.
Mechanisms for monitoring and logging are established for pre-production vetting.
Production:
The live environment where the application is available to end-users.
Includes details on infrastructure management, scaling, load balancing, and disaster recovery.
Security measures, compliance standards, and real-time monitoring tools are documented.
Continuous Deployment strategies for pushing changes to users with minimal downtime are detailed.
How to use the CI/CD diagram template in Miro
To harness the full potential of the CI/CD template, follow these simple steps:
Customization: Click to edit text and drag-and-drop elements to tailor the template to your project's unique pipeline structure.
Expand the Framework: Effortlessly add more shapes and connector lines using the automated diagramming features to scale the pipeline to your needs.
Integrate Artifacts: Drag any artifact onto your board to contextualize each stage—documentation, code snippets, or test results.
Why should you use a CI/CD template?
The benefits of employing a CI/CD diagram template are considerable:
Clarity in process: It provides a visual representation of the development pipeline, making complex processes understandable at a glance.
Enhanced collaboration: Teams can work together more effectively with a common visual language and understanding of the workflow.
Time efficiency: Streamlines the development process by providing a clear roadmap from development to deployment, reducing time-to-market.
Error reduction: By visualizing each step, teams can identify and address potential issues early, minimizing the risk of errors in the production environment.
Continuous improvement: A CI/CD template enables ongoing optimization of development practices by making it easy to identify bottlenecks or redundant steps.
If you prefer to start from scratch, Miro's diagramming tool is intuitive and comes with a wide range of diagramming shapes in Miro's extensive library, so you'll find just what you need.
Can the CI/CD template handle multiple project pipelines?
Absolutely. The template can be replicated or adjusted to accommodate as many project pipelines as needed.
Is the CI/CD template suitable for teams new to CI/CD practices?
Yes, it's designed to be user-friendly, making it an excellent tool for teams of any experience level to visualize and understand CI/CD workflows.
How can I track changes made to the CI/CD template?
Changes are logged, and version history can be reviewed to track the evolution of the pipeline diagram over time.
Can I integrate third-party tools into the CI/CD template?
While the template itself is a visual representation, it can be used with various third-party tools by adding links or notes to specific parts of the template, creating a dynamic and integrated project environment.
Get started with this template right now.
Pedigree Diagram Template
Works best for:
Diagrams, Education
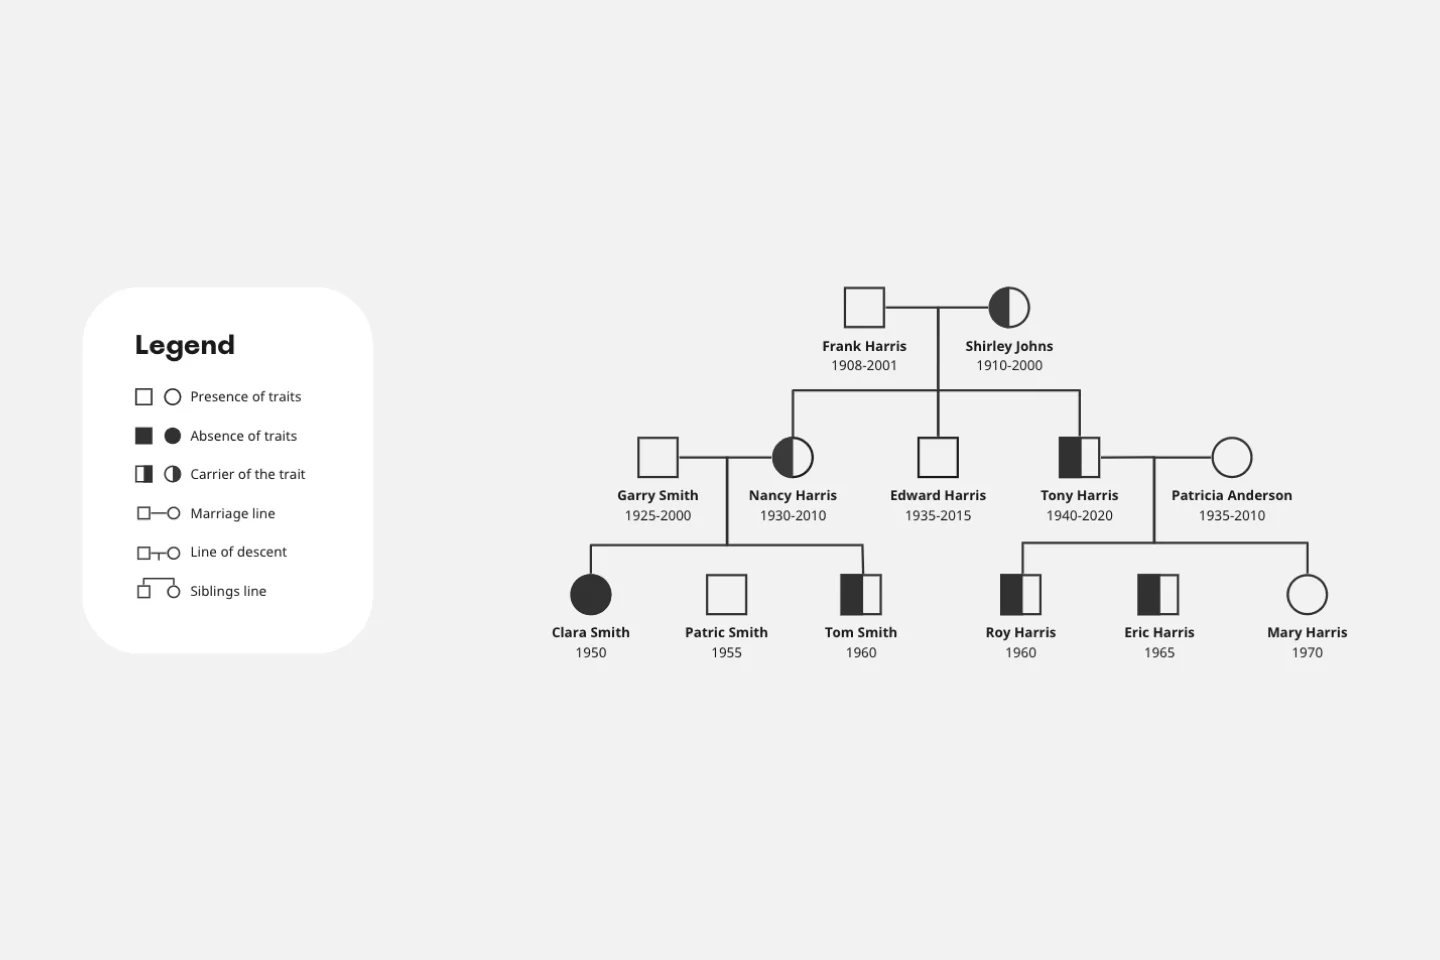
Use our Pedigree Diagram Template to show how traits and diseases are passed from one generation to the next. Whether you’re a doctor, farmer, or just someone interested in genetics, a Pedigree Diagram can help you identify hereditary traits.

Driver Diagram Template
Works best for:
Diagramming
The driver diagram template is a strategic visual tool that helps teams map out their primary objectives and break them down into actionable components. It presents goals, drivers, and specific change ideas in a coherent and interconnected format, ensuring clarity of objective. By doing so, every team member is aligned towards a common endpoint, fostering unified efforts. The visual nature of the template simplifies complex objectives, making it easier for teams to stay on track and measure their progress effectively.
UML Component Diagram Template
Works best for:
Mapping, Diagrams, Software Development
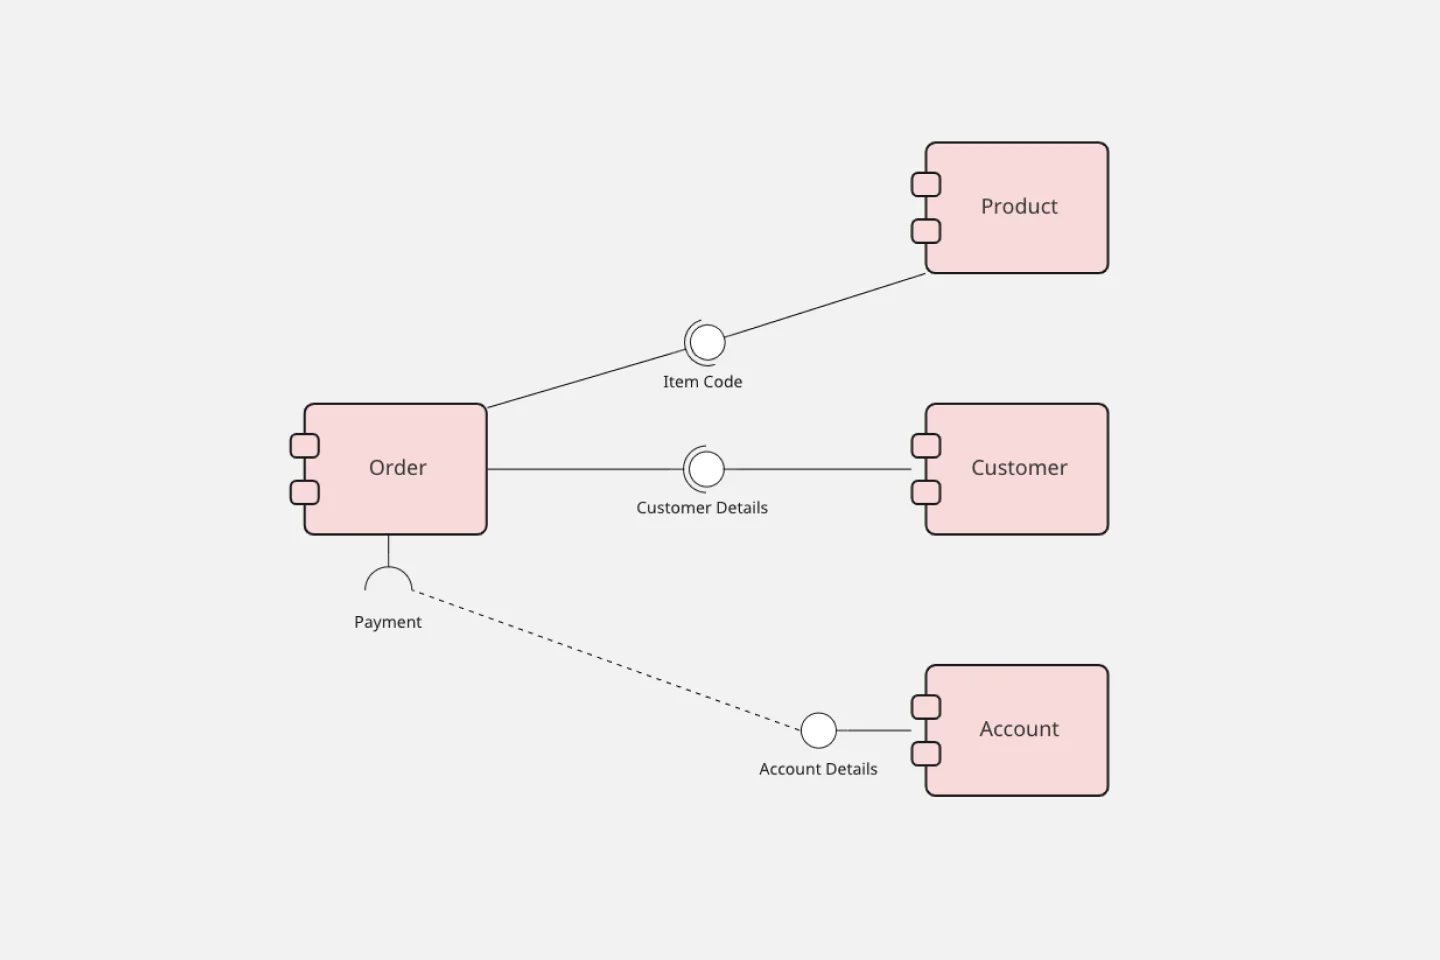
Use our Component Diagram template to show how a system’s physical components are organized and wired together. Visualize implementation details, make sure planned development matches system needs, and more — all in a collaborative environment.

Onion Diagram Template
Works best for:
Diagramming, Mapping and Diagramming
The Onion Diagram Template is a distinct tool designed to visually represent layers of a specific concept, system, or process, akin to the layers of an onion. Each concentric layer of the diagram provides insights into a different aspect or phase of the topic at hand, moving from the core foundational element outwards to more peripheral components. One of the prime benefits of this template is its ability to offer hierarchical clarity. Users can immediately discern the importance, sequence, or interrelation of different elements within a system, facilitating enhanced comprehension and efficient decision-making.
Vertical Organizational Chart
Works best for:
Diagramming, Organizational Charts, Organizational Design
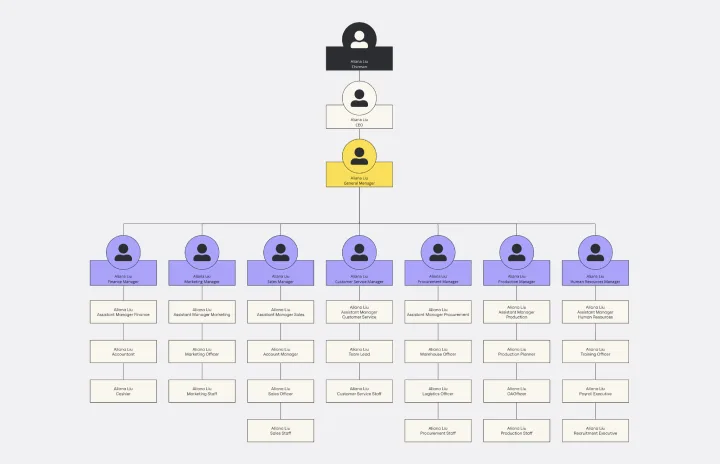
The Vertical Organizational Chart Template is an efficient way to illustrate the hierarchy of an entity in a top-down format. This tool helps represent roles and relationships in a clear manner, starting from the topmost authority and branching downwards. It allows for a better understanding of the flow of responsibilities and communication channels within the organization. One of its most significant advantages is promoting clear communication. Depicting the organization's structure helps avoid misunderstandings and ensures everyone is on the same page regarding the chain of command.
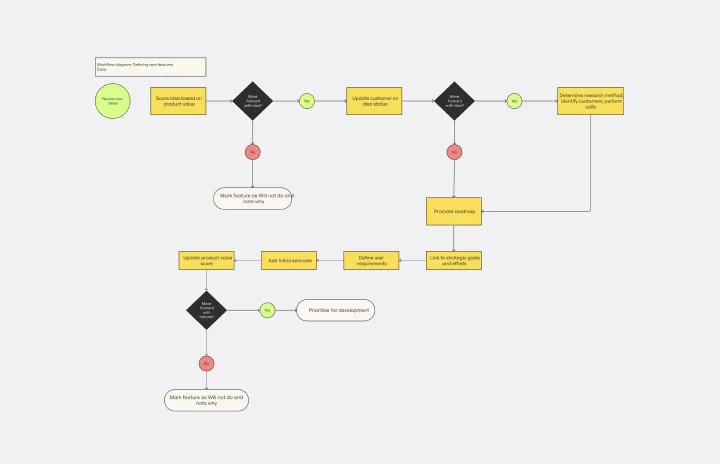
Workflow Diagram Template
Works best for:
Diagramming, Mapping, Process mapping
The Workflow Diagram Template maps out and represents processes or systems using standardized symbols and shapes. By delineating the various steps or stages in a process, it ensures that tasks flow seamlessly from initiation to completion. One of the standout benefits of using this template is its clarity. By translating processes into a visual format, all participants can gain a comprehensive understanding at a glance, eliminating confusion and ensuring everyone is on the same page. This clarity not only promotes efficient task execution but also fosters collaboration among team members.