Burndown Chart Template
Help your Agile team make their productivity and progress visible
Trusted by 65M+ users and leading companies


About the Burndown Chart Template
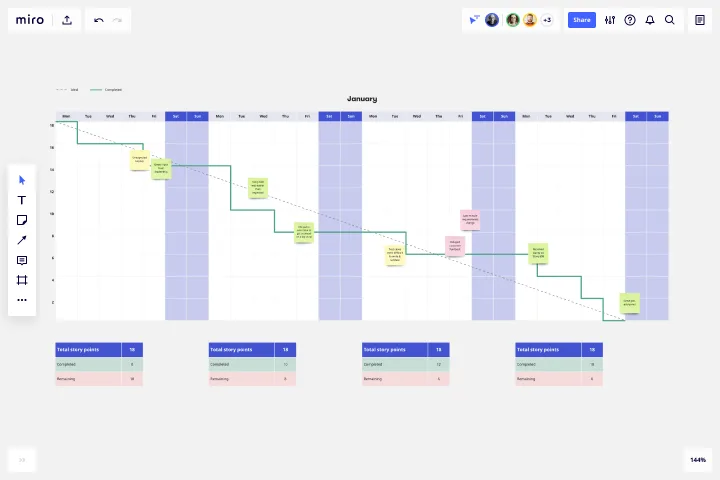
Burndown charts are visual graphs that show teams how much work is left to complete and how much time is available to finish the job.
A typical layout will have two lines representing the volume of work and the number of workdays. Team members leading and executing the day-to-day workload can use a burndown chart to make realistic project estimates.
The visual format helps project managers figure out the difference between the “ideal” progress of work and how the “actual” work is tracking. Teams can use a burndown chart to work toward specific goals and finish a project on time and within budget.
When to use a burndown chart
A burndown chart is a useful project management tool and can be a quicker alternative to a Kanban board or a Gantt Chart. With a burndown, the team can focus on the time left to finish tasks instead of each task’s specific breakdowns.
As a visual reference, burndown charts encourage team transparency and awareness of how much work is getting done on a day-to-day basis.
Burndown charts can also help individual team members realize their pace of work. By checking on it at least once a day, everyone can figure out how to adjust or maintain their output level according to project needs.
How to use the burndown chart template
Making your own burndown chart is easy with Miro's template. Simply follow these steps to get started:
1. Set a target
Set a target for the ideal number of story points you need to finish. Once “total story points” is set, that number should stay untouched for the duration of your team’s sprint.
By default, this template assumes your sprint will last 2.5 weeks. You can edit the X-axis to accommodate week-long, fortnightly, or month-long sprints as well. Your team should keep an eye on the “completed” and “remaining” numbers as these will be updated daily.
2. Set the completion rate
Edit the “ideal” completion rate line to set your target. The grey dotted line represents what the best-case productivity rate would look like. Consider this your visual baseline for whether or not your project is on track.
3. Add to the "completed" storyline
As your team completes story points on a daily basis, update the relevant sticky notes. Grow the solid line that represents your team’s actual completion rate by adding daily extensions. Keep in mind non-working days like weekends or public holidays where progress slows down or isn't expected.
4. Check-in regularly
Keep an open line of communication with your team to set expectations, predict risks, and keep your project on track. Priorities will evolve, and stakeholders may come back to your team with new requests. If your team keeps a record of their progress, they can push back on unreasonable requests together.
A burndown chart tracks your team’s daily progress honestly. Burndowns should also account for when new items are added after the sprint kicks off.
5. Plan future sprints based on previous ones
Use the chart as a reference to plan for future sprints. The chart can help you visualize the impact of new stakeholder requests over time and how much your team can do in an allocated sprint period. Notice a large productivity spurt at the end of your sprint? Break tasks into smaller, manageable tasks for your next sprint.
Get started with this template right now.
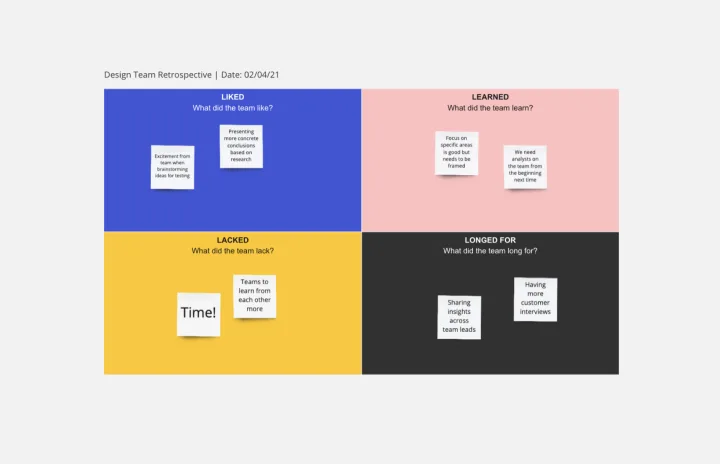
4 L's Retrospective Template
Works best for:
Retrospectives, Decision Making
So you just completed a sprint. Teams busted their humps and emotions ran high. Now take a clear-eyed look back and grade the sprint honestly—what worked, what didn’t, and what can be improved. This approach (4Ls stand for liked, learned, lacked, and longed for) is an invaluable way to remove the emotion and look at the process critically. That’s how you can build trust, improve morale, and increase engagement—as well as make adjustments to be more productive and successful in the future.
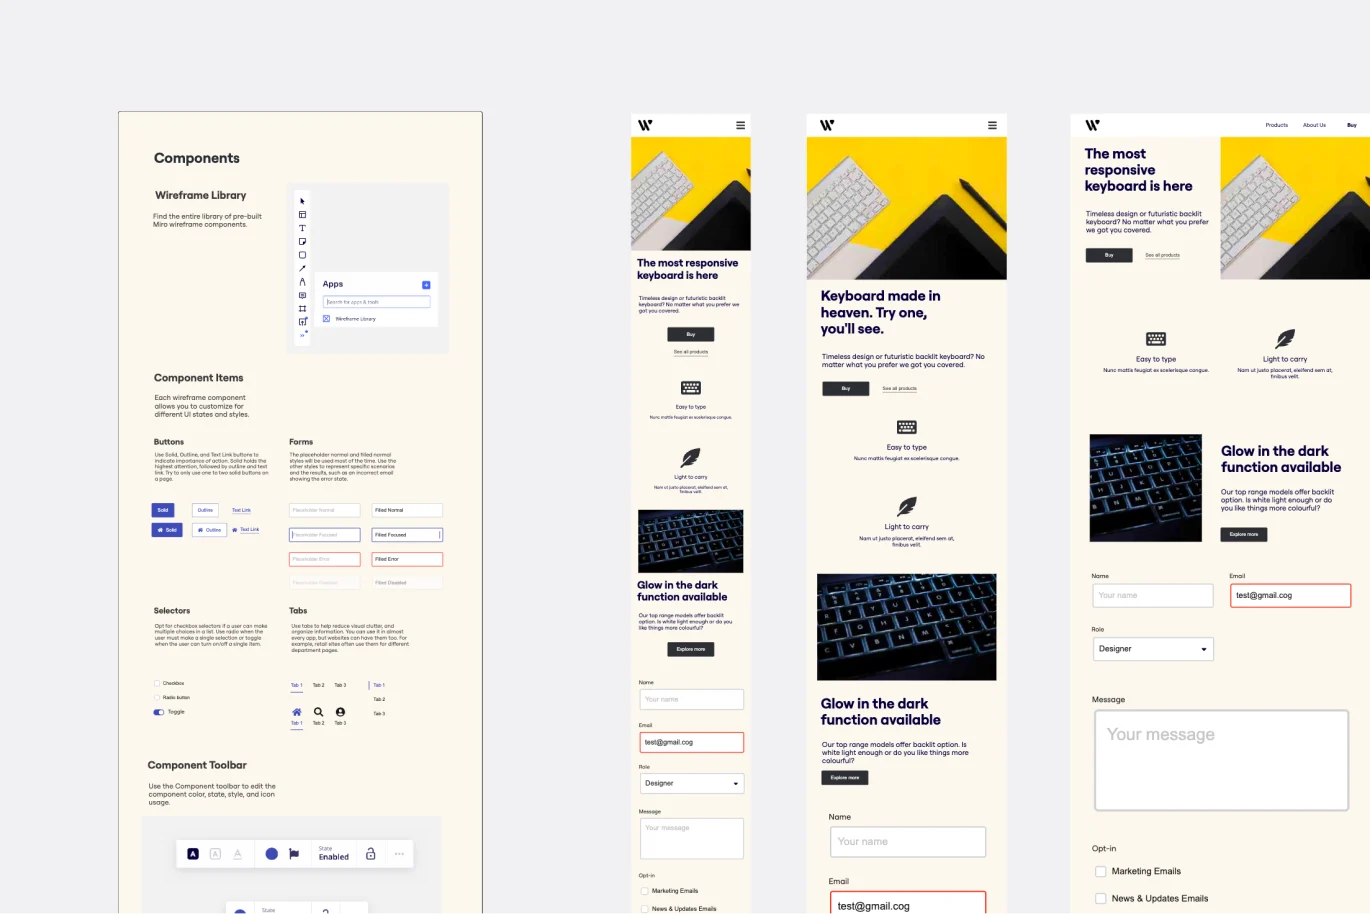
Website Wireframing Template
Works best for:
Wireframes, User Experience
Wireframing is a method for designing a website at the structural level. A wireframe is a stylized layout of a web page showcasing the interface elements on each page. Use this Wireframe Template to iterate on web pages quickly and cheaply. You can share the wireframe with clients or teammates and collaborate with stakeholders. Wireframes allow teams to get stakeholder buy-in without investing too much time or resources. They help ensure that your website’s structure and flow will meet user needs and expectations.
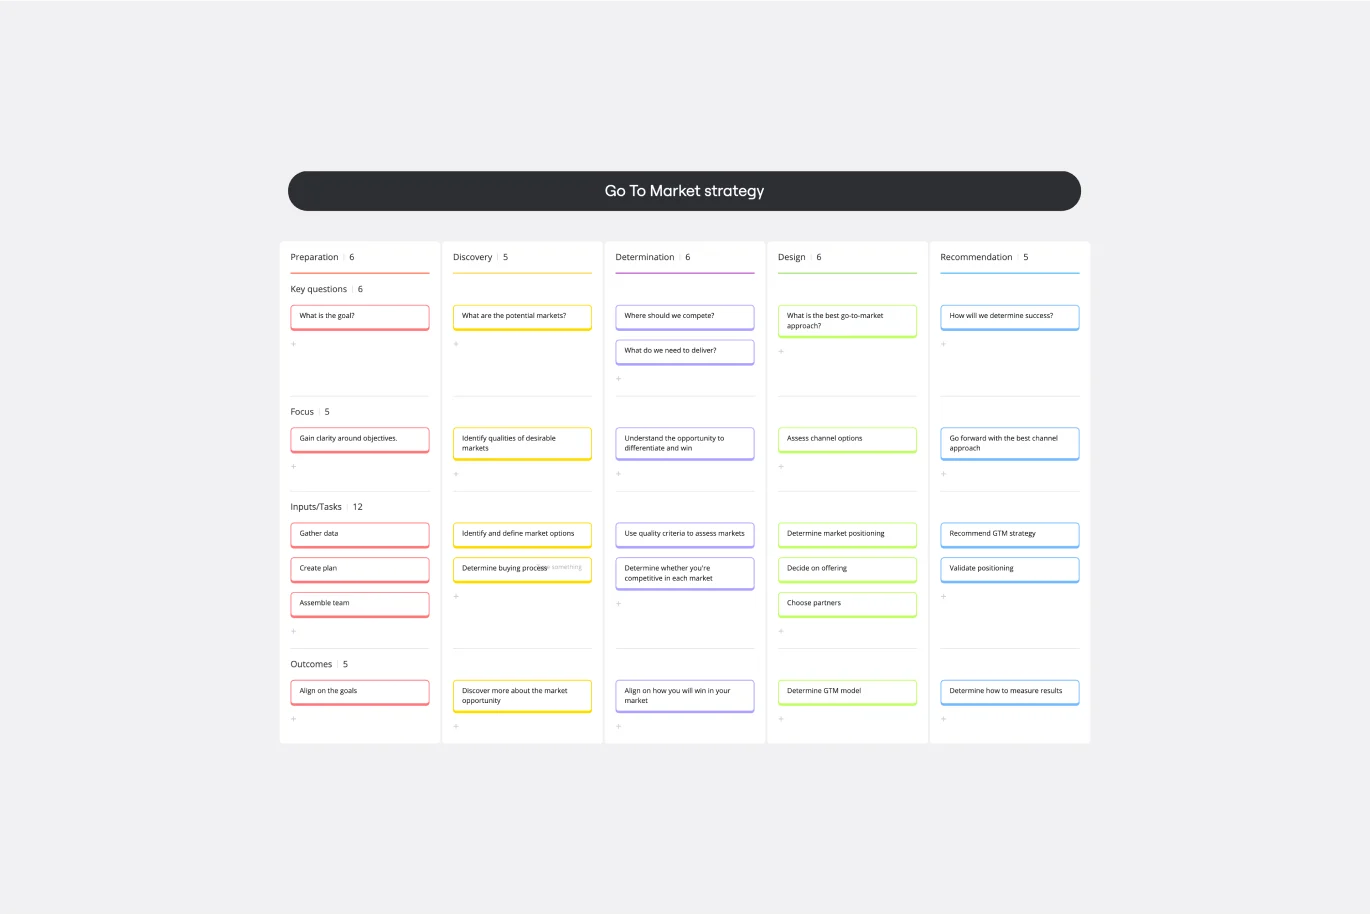
Go-to-Market Strategy Template
Works best for:
Marketing, Desk Research, Strategic Planning
It doesn’t matter how innovative or effective a new product is — if it doesn’t get noticed and adopted by the right audience, the product won’t get off the ground. That’s where your Go-to-Market Strategy comes in. It’s a single resource that houses all of your research, insights, and data, and includes your business plan, target audience, marketing approach, and sales strategy. A GTM is especially important for any startups who grow fast, have to make split-second decisions, and have to be fully in sync.
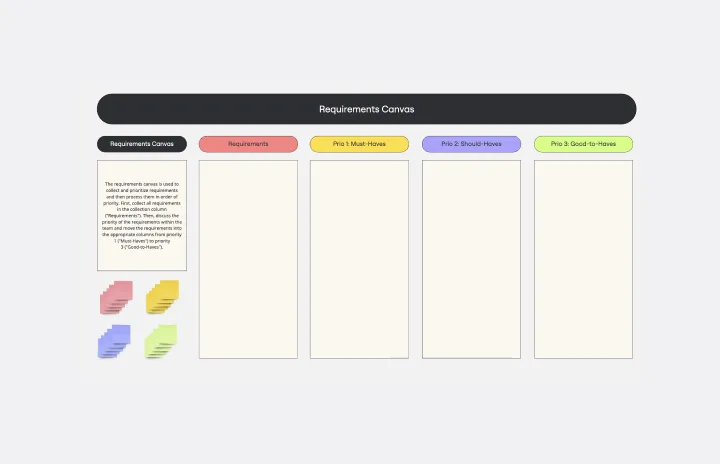
Requirements Gathering Template
Works best for:
Product , Strategy and Planning
The Requirements Gathering Template is an indispensable tool for project teams. It is the perfect solution for those who want to ensure their objectives are crystal clear and prioritize them efficiently. The three-category hierarchy created by this template - must-haves, should-haves, and good-to-haves - is an excellent way to streamline project requirements and allocate resources effectively. Any project team looking to optimize their workflow should consider this tool a must-have. It is a shining example of organized foresight, which is critical in today's world, where clarity is crucial.
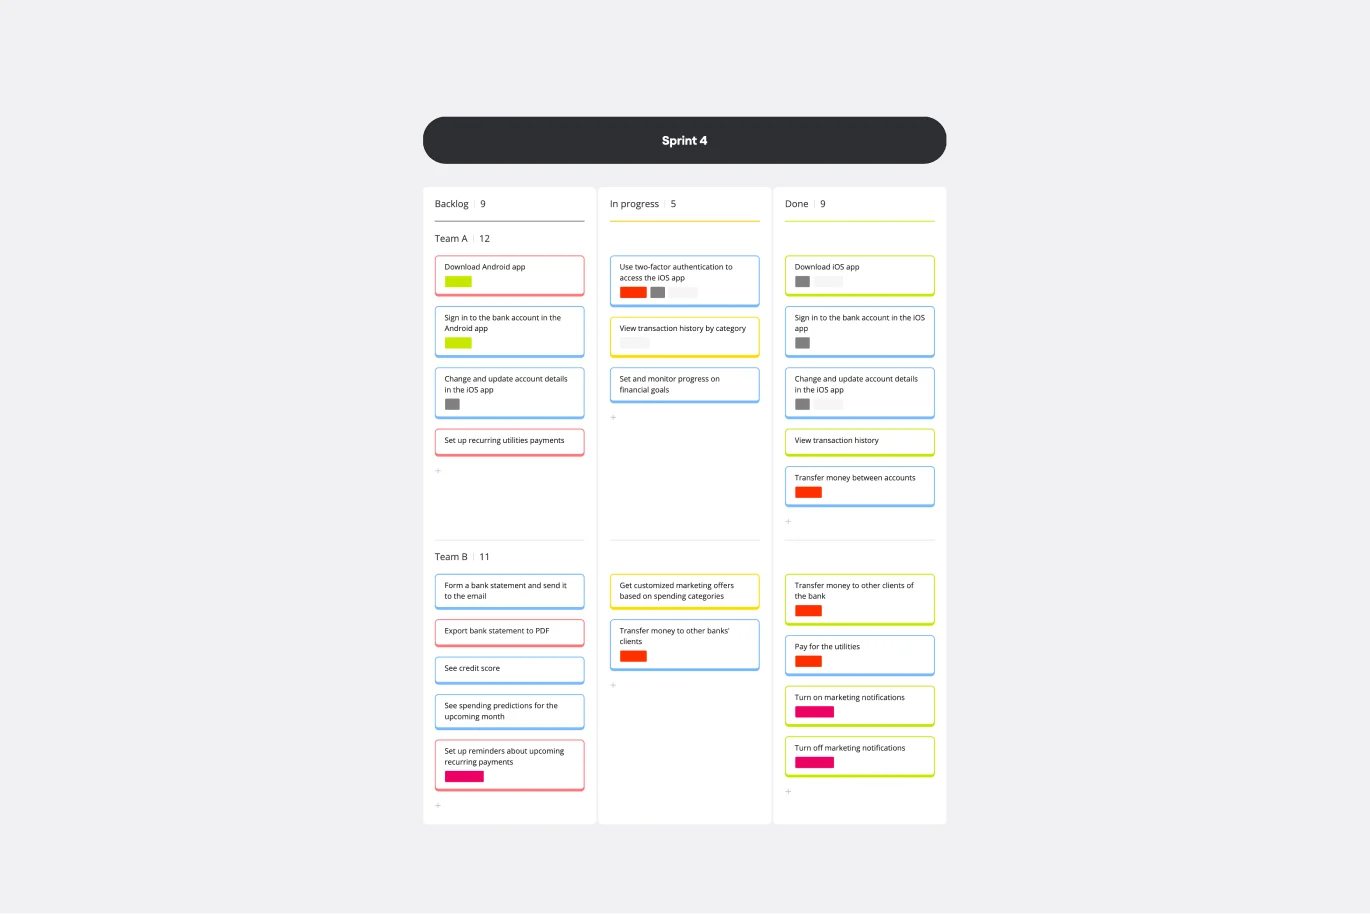
Kanban Framework Template
Works best for:
Kanban Boards, Agile Methodology, Agile Workflows
Optimized processes, improved flow, and increased value for your customers — that’s what the Kanban method can help you achieve. Based on a set of lean principles and practices (and created in the 1950s by a Toyota Automotive employee), Kanban helps your team reduce waste, address numerous other issues, and collaborate on fixing them together. You can use our simple Kanban template to both closely monitor the progress of all work and to display work to yourself and cross-functional partners, so that the behind-the-scenes nature of software is revealed.
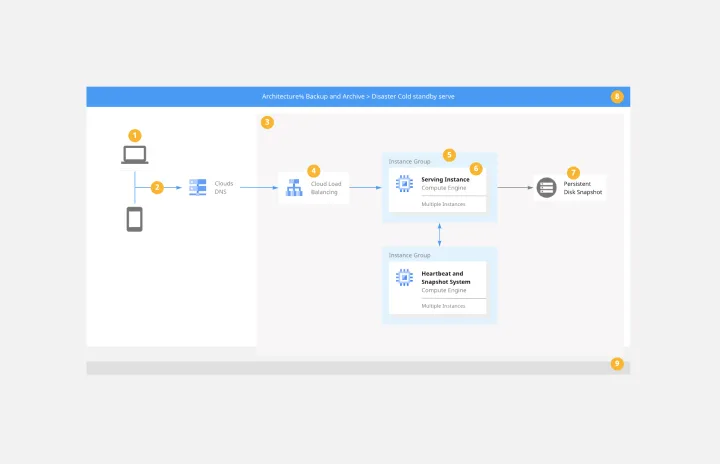
Google Cloud Architecture Diagram Template
Works best for:
Software Development, Diagrams
Use the Google Cloud Architecture Diagram template to clearly visualize the deployment of your application and allow you and your team to optimize processes. The GCP template gives you a great overview of your application architecture, and it helps you to iterate quickly and better manage your application development, deployment, and documentation. Try it out and see if it works for you.