Block Diagram Template
Gain a better understanding of your current systems and build new ones.
Trusted by 65M+ users and leading companies


About the Block Diagram Template
The block diagram template is a free, ready-to-use flowchart template, which you can use to model objects in a system and visualize how they connect to each other.
Opening the template allows you to start customizing it right in Miro, saving you from having to create one from scratch, while giving you plenty of diagramming tools to make it your own — such as shapes, text boxes, and connection lines. In other words, the block diagram template makes it easy for anyone to get a high-level overview of complex systems, and to visualize them in digestible ways.
How to create a block diagram using Miro’s template
Ready to try out the block diagram template? Here are four steps to help you make the most of it:
Step 1: Identify your goal
To get started, scroll to the top of this page and click on the “Use template” button. That’ll open the block diagram template up right in Miro, allowing you to start filling it in immediately. If you’re collaborating with teammates, don’t forget to invite them to edit the template by clicking the blue “Share” button on the top right of your Miro board.
But before you start filling the template in, identify the system or process you’re trying to visualize with your block diagram — whether you’re building a new control system, representing a complex subway map, or improving an existing business process. When collaborating, talk to your teammates to align expectations. For the sake of learning how to use this template, let’s pretend you’re trying to visualize the process of serving lemonade.
Step 2: Fill in the input and output
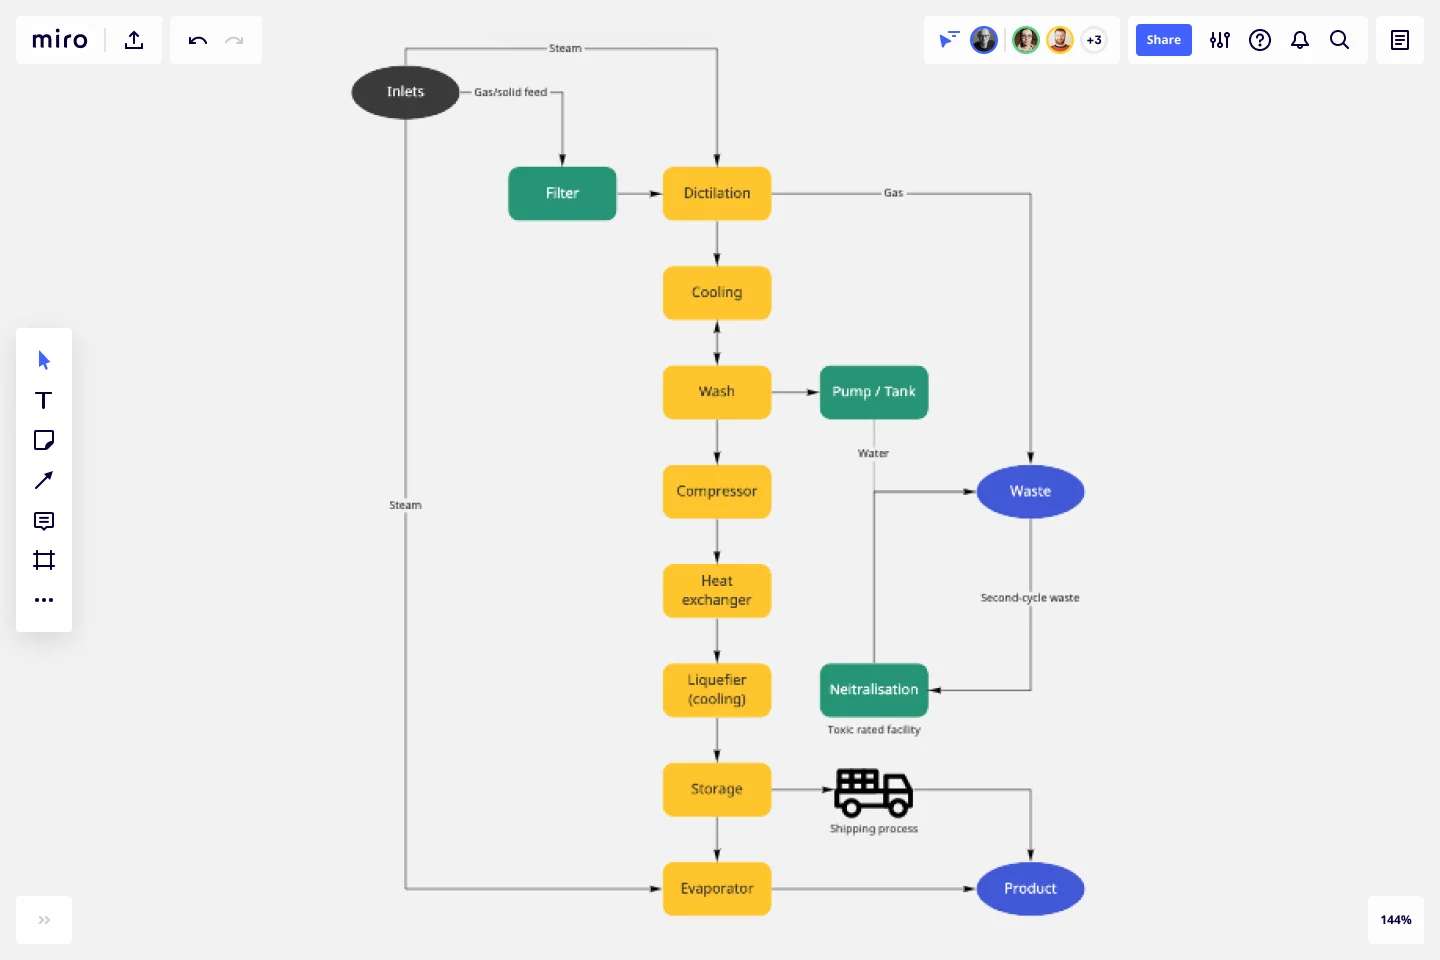
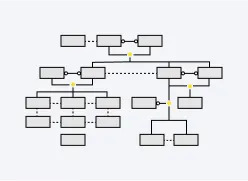
A block diagram typically depicts processes from start to finish — beginning with an input and ending with an output. The black oval on the top left of your template represents the input, while the two blue ovals on the right represent two possible outputs. The rest of the blocks represent all the important components or steps that are part of the process you’re visualizing.
Double-click on the text box in the black oval on the left to add your own input. Going back to the example of serving lemonade, write “pick lemons.” Next, edit the text boxes in the blue ovals on the right to add your outcomes by writing “served lemonade” in one of them. Since making lemonade can lead to peel and seed waste, we can keep the other blue oval’s default text as “waste.”
That said, feel free to add or delete ovals depending on the number of outcomes you’d like to portray.
Step 3: Fill in the process blocks
Next, it’s time to fill in the green and yellow boxes — also known as the process blocks. These blocks represent the various steps it takes to get from input to output, and depending on how complex the process you’re visualizing is, you may not need as many as you see in the template.
You’ll also notice that the template comes with eight yellow process blocks and three green ones. The yellow ones represent the core set of steps for completing your process, whereas the green ones represent any additional steps you need to take before or after.
In this case, our core steps (yellow blocks) refer to the process of making the lemonade itself, while the additional steps (green block) refer to anything we need to do before or after that — like gathering the ingredients or actually serving the juice. Our lemonade recipe is simple, so go ahead and delete five of the yellow blocks so that you only have three left. Then, write “squeeze lemons” in the first one, “add sugar” in the second one, and “stir” in the third one.
Then edit the text for the first green block on the left to say “gather other ingredients”. This represents the step you need to take before squeezing lemons. In the green block that leads to the “waste” outcome from step 2, edit the text to say “collect peels”. This represents the step you need to take before you generate waste. Similarly, edit the text in the final green block – the one that leads to “served lemonade” – to say “pour into glass”.
Step 4: Rearrange and label the arrows
You’ve added all the steps, but you might notice that the arrows are still pointing in the default directions they came in when you first opened the block diagram template. Take a moment to rearrange the arrows to make sure your diagram accurately depicts the process of making lemonade in chronological order. If you’re not sure where to start, remember that your block diagram should begin with an input block, continue toward process blocks, and end with the output block.
To delete any unnecessary arrows, simply click on them and hit “delete” on your keyboard. To add a new arrow, click on any process block to reveal the blue dots around it. Then, click on the dot where you want your arrow to start and drag it to where you want it to end. You can also click on the text boxes along the arrows to edit the text or remove them altogether.
And there you have it, a personalized block diagram template according to your goals.
Benefits of using the block diagram template
Miro’s online block diagram maker not only makes it easy for you to create quickly but also comes with plenty of customization options to help you truly make it your own. Not only does the block diagram template come with pre-made shapes and text boxes ready for you to fill in, but it’s also easy to modify — whether you want to add more blocks and connection lines, or delete the ones you don’t need.
You can even change everything from your Miro board’s background color to the thickness of your connection lines, making it easy to apply your brand style or simply play with the look and feel.
Want to refer to important notes on the go? Embed entire Google Documents, Sheets, or Slides right in your Miro board’s infinite canvas, allowing you to refer to them while filling in the block diagram template. Want a quicker way to add notes? Simply copy and paste text onto your canvas, or drag and drop images and screenshots. In other words, Miro’s block diagram template isn’t just a creative outlet; it’s also an all-in-one solution for speeding up your entire workflow.
What is a block diagram template?
A block diagram template is a pre-made diagramming template you can use to visually represent complex systems or processes. It uses blocks to represent individual components within that system or process, and arrows to represent the relationships between those components. Some common use cases for a block diagram include visualizing a subway system and mapping a customer journey.
Can I customize the block diagram template to suit my needs?
Yes, you can easily customize the block diagram template by using Miro’s robust diagramming and styling tools. That includes adding or deleting more blocks and arrows, changing the colors and shape sizes, and editing the text — all according to your unique goals and interests. These features are especially helpful for teams looking to create a block diagram in line with their brand guidelines.
How can I share my block diagram template with others?
There are many ways to share your block diagram template — from exporting it as a PDF or image to inviting collaborators to view your Miro board and add comments. You can also share your Miro board via a link, or generate a code to embed it elsewhere. It’s all a matter of what method suits your team best.
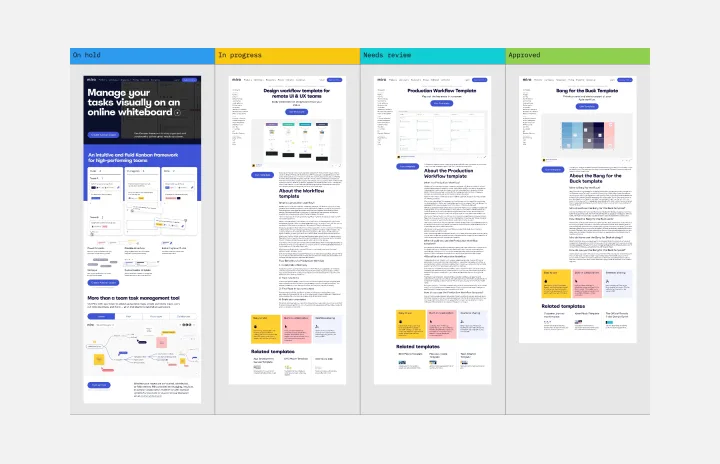
Get started with this template right now.
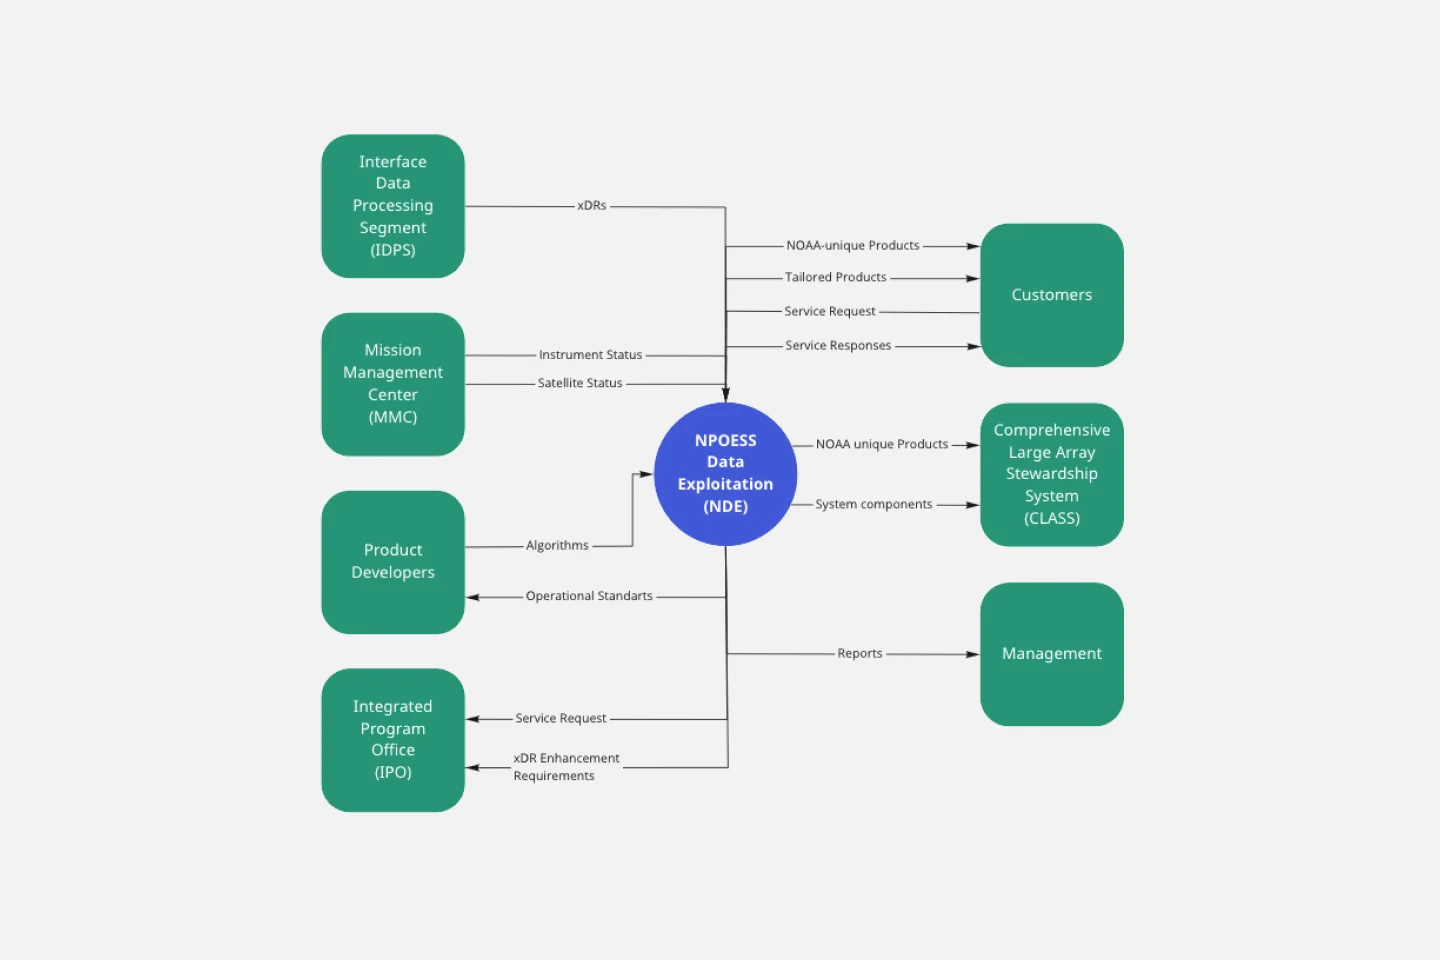
Context Diagram Template
Works best for:
Business Management, Mapping, Diagrams
A context diagram is a perfect tool to view an entire system as a single process and understand how external factors interact with it. These external factors can include customers, developers, management, and more. The Context Diagram Template is your tool for creating this diagram.
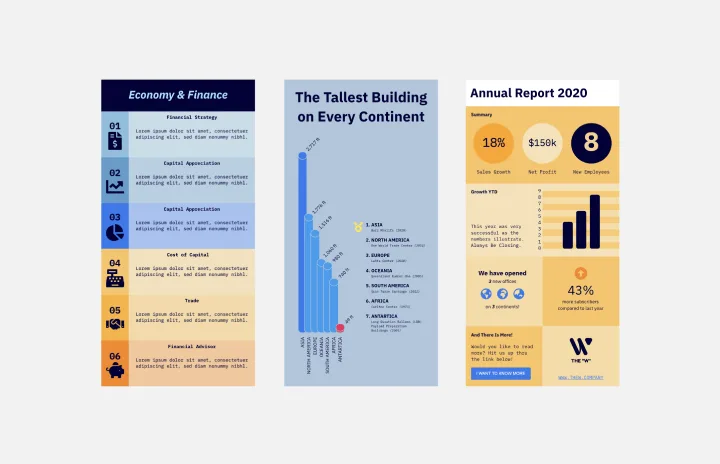
Infographic Template
Works best for:
Marketing, Desk Research, Documentation
As we bet you’ve experienced, data can get pretty dense and dry. But you need it to be compelling, memorable, and understandable. The solution? Infographics. These are tools that let you present information in a visually striking way and turn quantitative or qualitative data into stories that engage and resonate. Whoever you’ll be presenting to — customers, donors, or your own internal teams — our template will let you design an infographic that combines text and visuals to break down even the most complicated data.
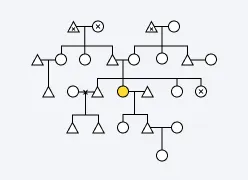
Kinship Diagram Template
Works best for:
Mapping, Diagrams
Use a Kinship Diagram Template to map out a clear picture of your family relationships. With clear guidelines for kinship notation, you can navigate everything from your closest uncle to your third cousin twice removed. Try the Kinship Diagram Template to understand your family relationships.
Workflow Template
Works best for:
Project Management, Workflows
The digital world requires collaboration, and better collaboration leads to better results. A workflow is a project management tool that allows you to sketch out the various steps, resources, timeline and roles necessary to complete a project. It can be used on any multi-step project, whether it’s a business process or otherwise, and is ideal for plotting out the tangible actions you’ll need to take to achieve a goal and the order in which you need to complete those actions.
Family Tree Template
Works best for:
Education, Mapping
Family trees help you make sense of complicated family relationships, even generations back. With this Family Tree Template, you can quickly and easily add your siblings, parents, and extended family members. Plus, add extra information, notes, and even images to create a vibrant family tree.
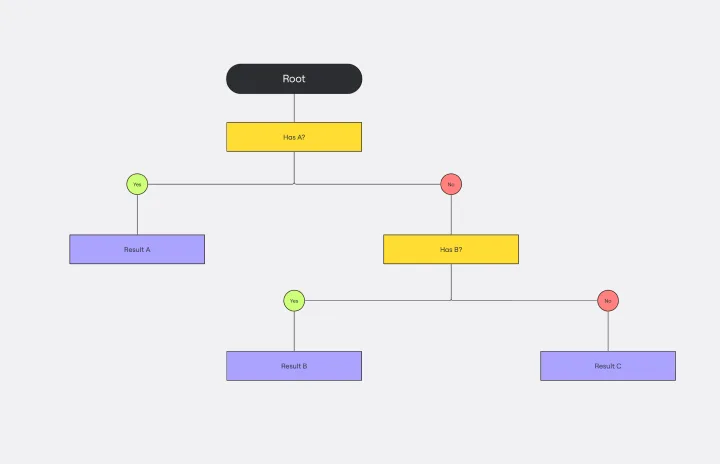
Dichotomous Key Template
Works best for:
Diagramming
The Dichotomous Key Template stands out as an exceptional tool for simplifying complex classification processes, significantly enhancing learning experiences. Breaking down intricate subjects into a series of binary decisions transforms how information is absorbed and understood. This systematic approach not only aids in retaining intricate details but also makes the learning process more engaging and interactive. Whether for educational purposes or professional use, the template’s design fosters a deeper comprehension of the subject matter, allowing learners and professionals to navigate complex scenarios with clarity and ease.