Azure Demand Forecasting Template
The Azure Demand Forecasting diagram will show the architecture of a demand forecast, making it easier for you to predict data consumption, costs, and forecast results.
Trusted by 65M+ users and leading companies


About the Azure Demand Forecasting
The Azure Demand Forecasting diagram will show the architecture of a demand forecast, making it easier for you to predict data consumption, costs, and forecast results. Azure is Microsoft’s cloud computing platform, designed to provide cloud-based services such as remote storage, database hosting, and centralized account management.
Keep reading to learn more about the Azure Demand Forecasting Template.
What is an Azure Demand Forecasting Template
The Azure Demand Forecasting Template, like any other diagram, visually shows the necessary steps for demand forecasting. The Azure Demand Forecasting Template has unique icons categorized into Stencils. Each Stencil focuses on a specific task to make it easier for users to access the right set of icons.
When to use Azure Demand Forecasting Template
You can use the Azure Demand Forecasting Template to predict demand for a product in a retail/online store, forecast hospital visits, and anticipate power consumption.
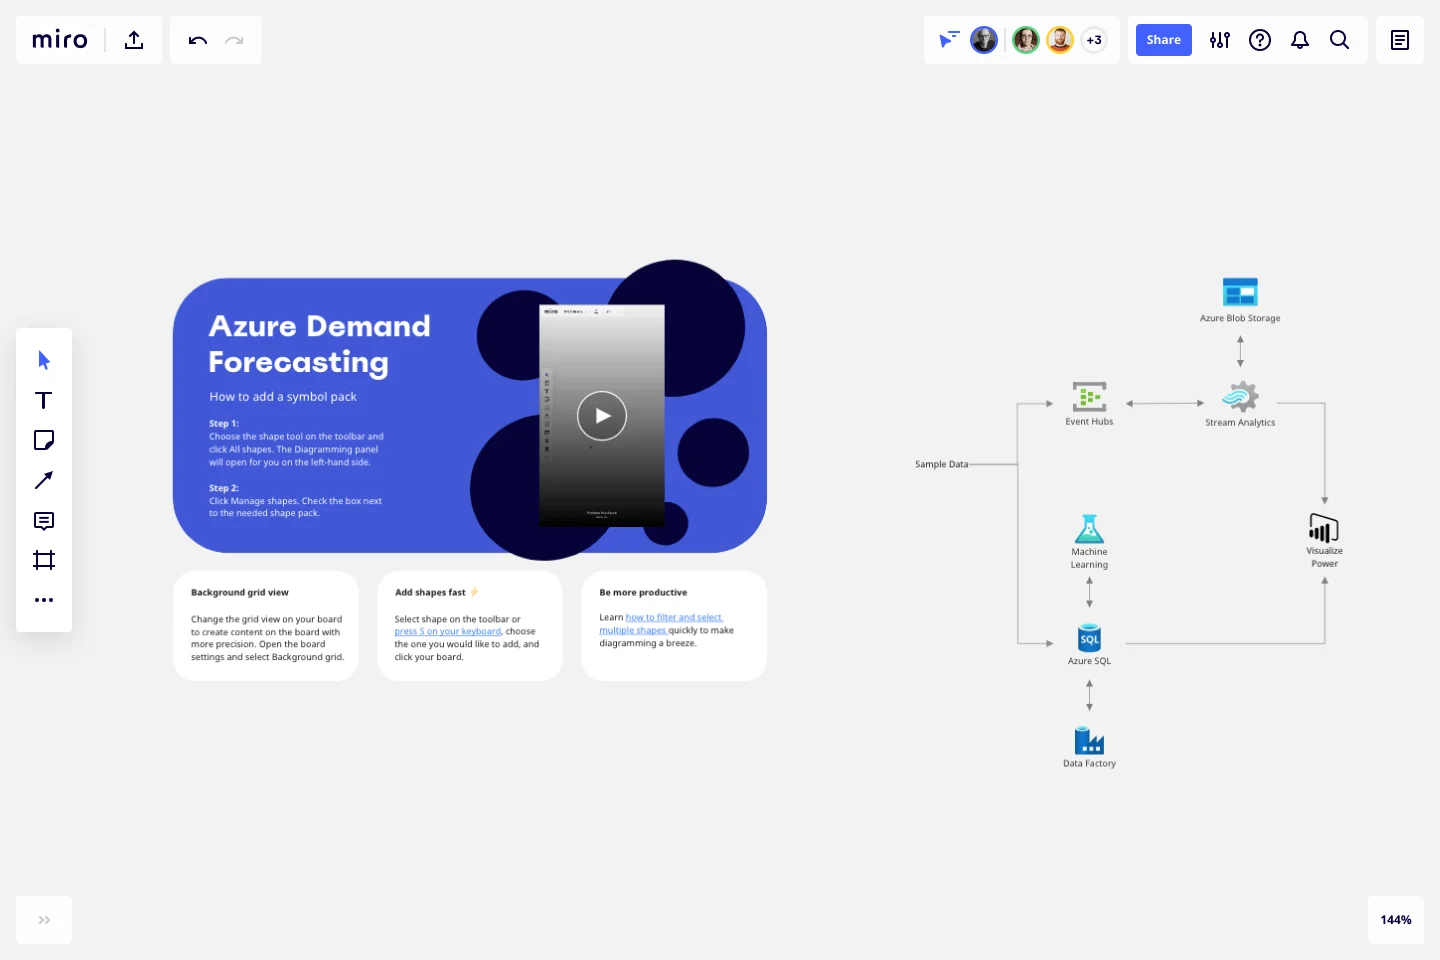
The Azure Demand Forecasting Template combines several Azure services to provide actionable predictions:
Event Hubs collects real-time consumption data.
Stream Analytics aggregates the streaming data and makes it available for visualization.
Azure SQL Database stores and transforms the consumption data.
Machine Learning implements and executes the forecasting model.
Power BI visualizes the real-time energy consumption and the forecast results.
Finally, Data Factory orchestrates and schedules the entire data flow.
How-To Section:
Here are some of the Stencils and their meaning when implementing the Azure Demand Forecasting Template:
How do I make an Azure Demand Forecasting Template?
To make an Azure Demand Forecasting in Miro is easy. You can use our Azure Demand Forecasting Template and customize it as you see fit. Once you have the diagram structure, you can start adding the icons. You can find the icons under our Azure Icon Set integration.
Get started with this template right now.
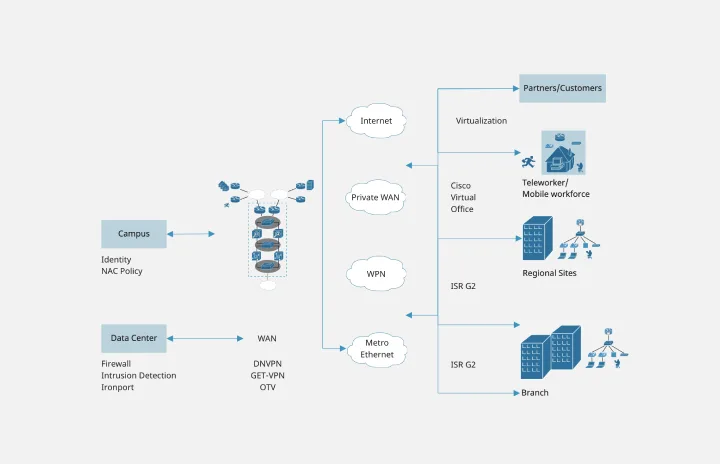
Cisco Recommended Security Architecture Template
Works best for:
Software Development, Diagrams
Cisco offers data center and access networking solutions built for scale with industry-leading automation, programmability, and real-time visibility. The Cisco Recommended Security Architecture uses Cisco elements to visually show the network design of Cisco networks.
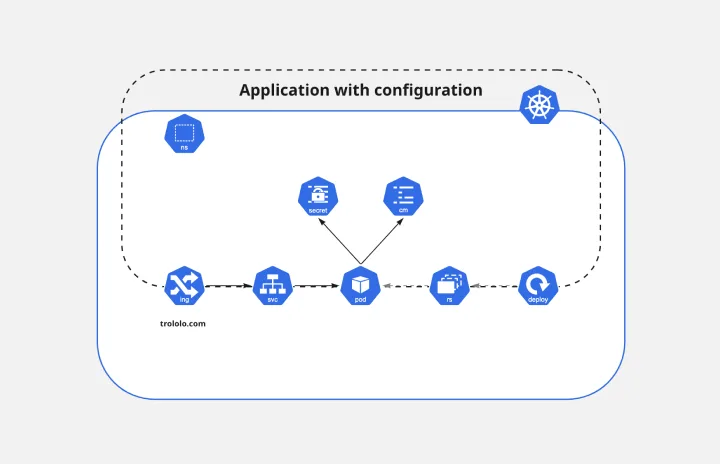
Kubernetes Application Template
Works best for:
Software Development, Diagrams
Use the Kubernetes Application template to manage enterprise-ready containerized applications better. You can now get your team more agile when dealing with portability, licensing, and consolidated billing. The Kubernetes Application template allows you to run deployments anywhere, facilitating the management of your applications. Try it out and see if it’s the best fit for you and your team.
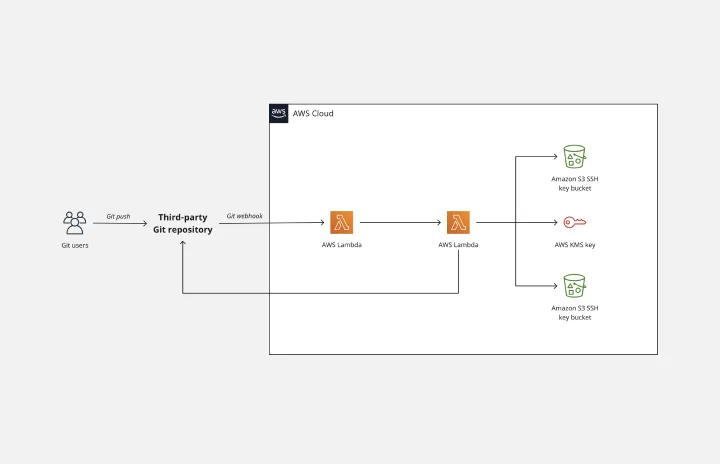
AWS Git to S3 Webhooks Template
Works best for:
Software Development, Diagrams
The AWS Git to S3 Webhooks Template is a visual representation of Git webhooks with AWS services Quick Start architecture. You can now have an overview of your AWS architecture with Miro’s AWS Git to S3 Webhooks Template, track your cloud solutions easily, and optimize processes like never before.
Data Flow Diagram Template
Works best for:
Flowcharts, Software Development, Diagrams
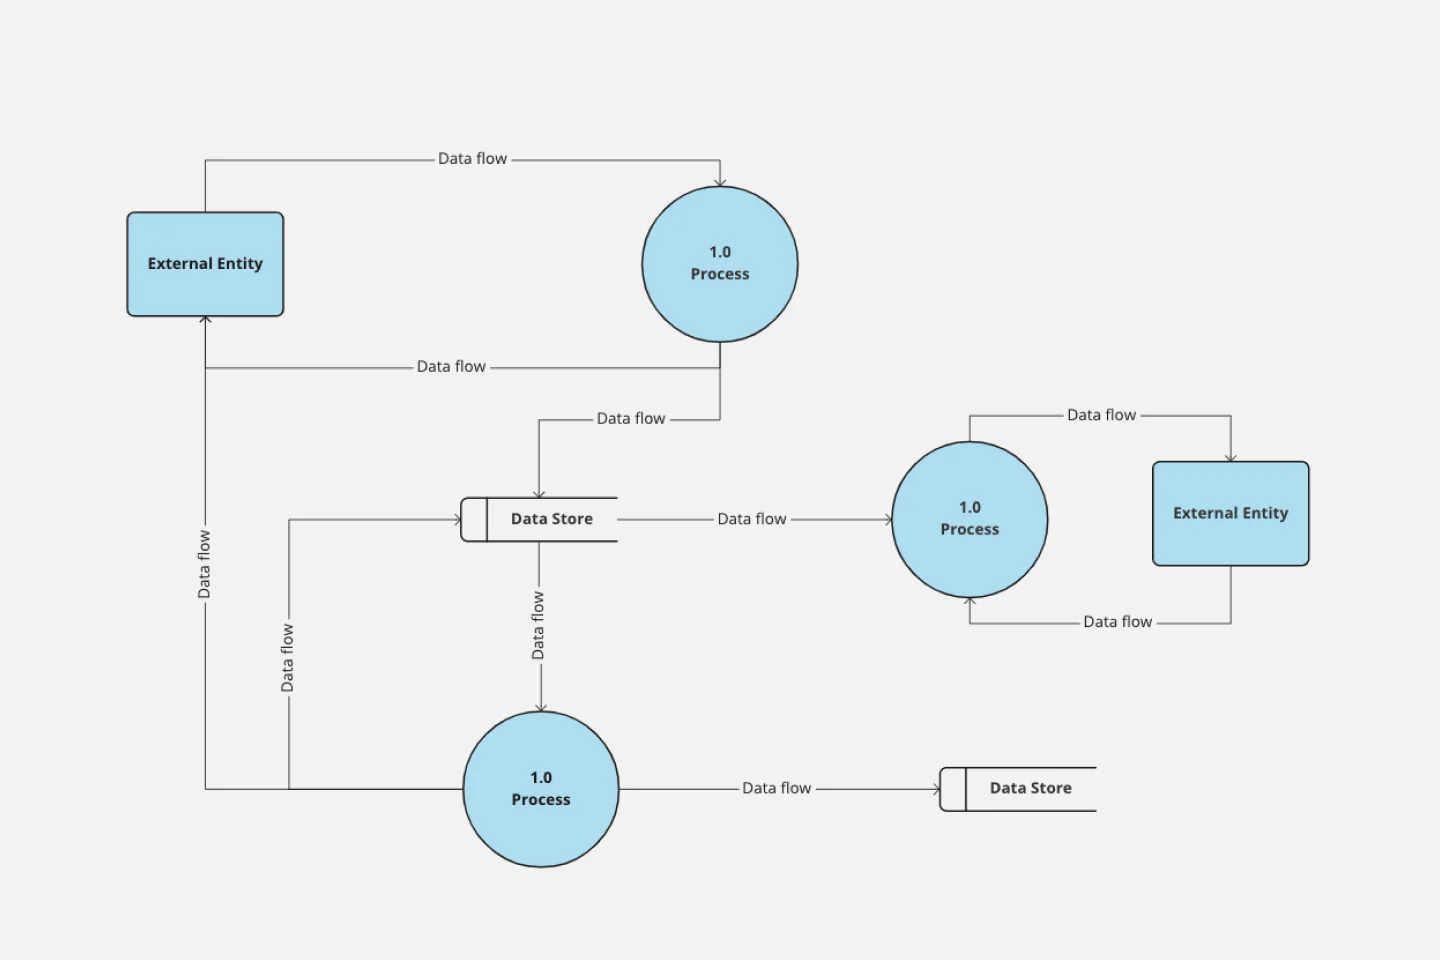
Any process can get pretty complex, especially when it has multiple components. Get a better grasp of your process through a data flow diagram (DFD). DFDs create a simple visual representation of all components in the flow of data and requirements in an entire system. They’re most often used by growth teams, data analysts, and product teams, and they’re created with one of three levels of complexity—0, 1, or 2. This template will help you easily build the best DFD for your process.
Kano Model Template
Works best for:
Desk Research, Product Management, Prioritization
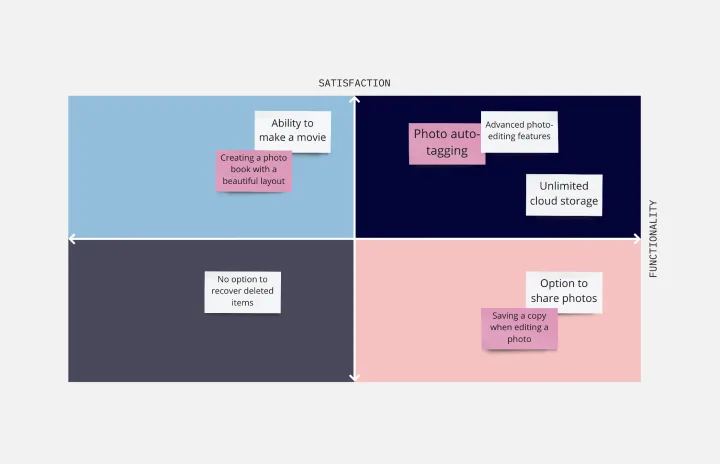
When it comes down to it, a product’s success is determined by the features it offers and the satisfaction it gives to customers. So which features matter most? The Kano model will help you decide. It’s a simple, powerful method for helping you prioritize all your features — by comparing how much satisfaction a feature will deliver to what it will cost to implement. This template lets you easily create a standard Kano model, with two axes (satisfaction and functionality) creating a quadrant with four values: attractive, performance, indifferent, and must-be.
Entity Relationship Diagram Template
Works best for:
Flowcharts, Strategic Planning, Diagrams
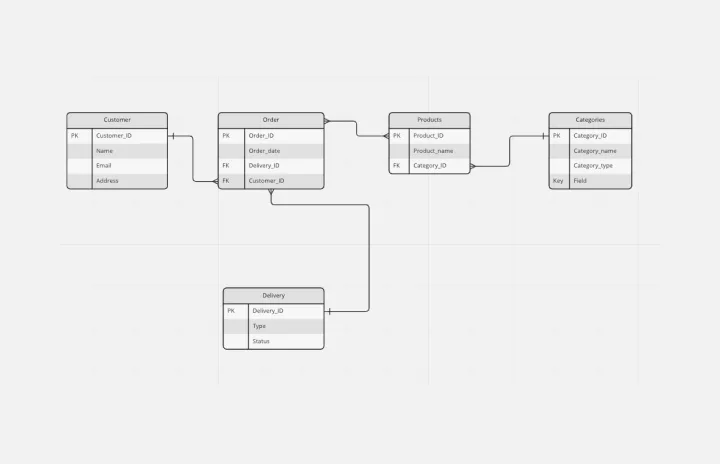
Sometimes the most important relationships in business are the internal ones—between the teams, entities, and actors within a system. An entity relationship diagram (ERD) is a structural diagram that will help you visualize and understand the many complex connections between different roles. When will an ERD come in handy? It’s a great tool to have for educating and onboarding new employees or members of a team, and our template makes it so easy to customize according to your unique needs.