Azure Architecture Diagram Template
This diagram will help you visualize the combination of any data and build and deploy custom machine learning models at scale.
Trusted by 65M+ users and leading companies


About the Azure Architecture Diagram template
The Azure Architecture Diagram Template will help you visualize and develop sophisticated, transformational apps using state-of-the-art machine learning algorithms. It will also allow you to create architecture diagrams, combine data, and build and deploy custom machine learning models at scale.
Keep reading to learn more about the Azure Architecture Diagram Template.
What is an Azure Architecture Diagram Template
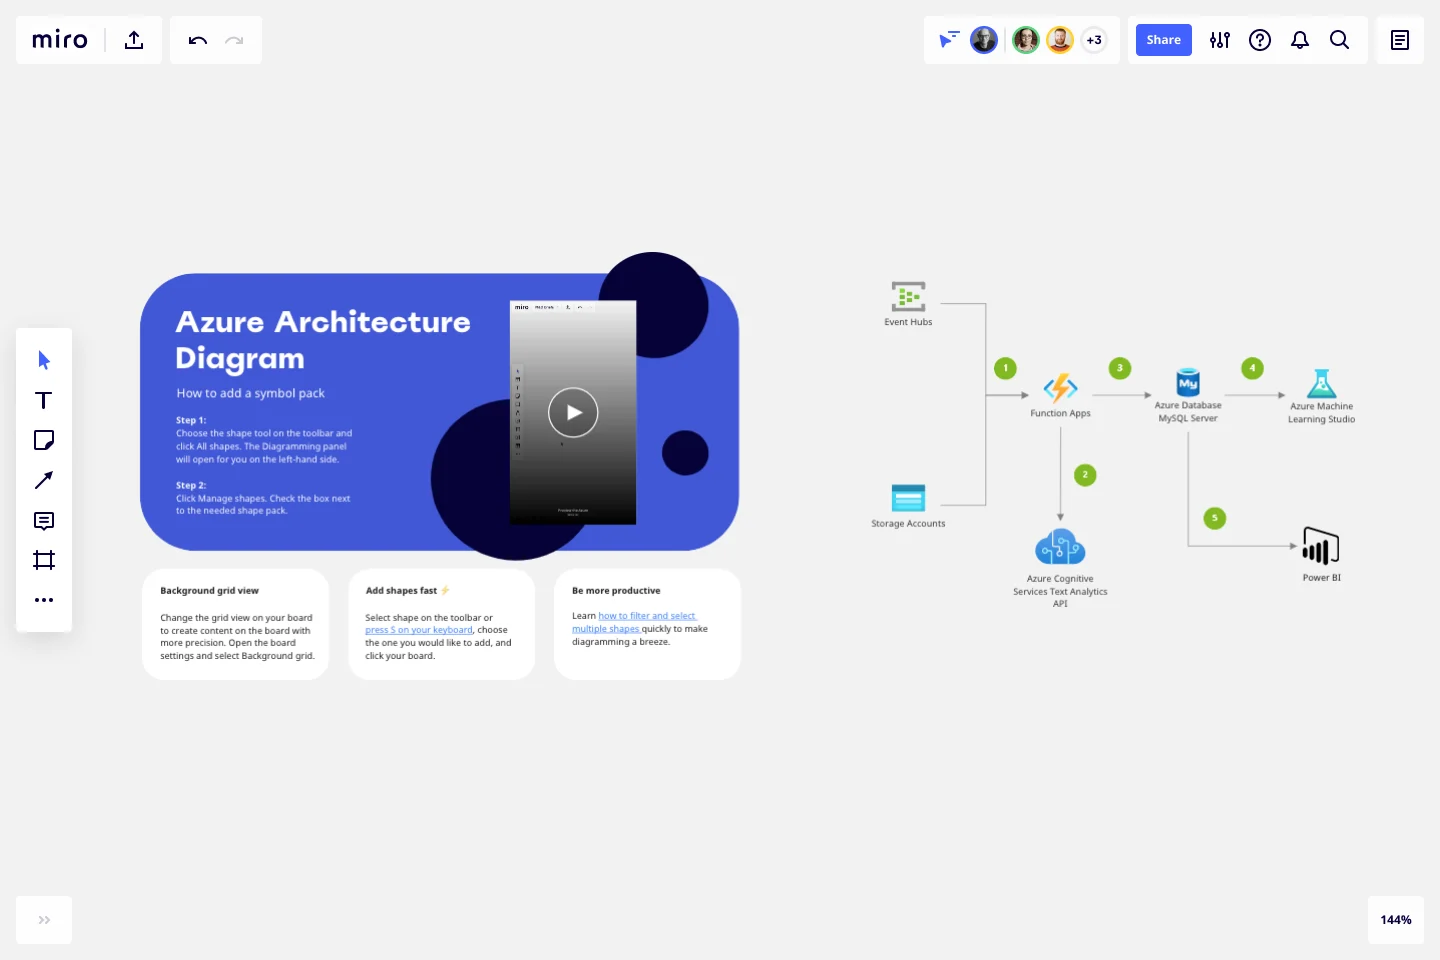
The Azure Architecture Diagram Template, like any other network diagram, visually shows the steps of a given process, in this case, of the cloud architecture framework. The Azure Architecture Diagram has unique icons categorized into Stencils. Each Stencil focuses on a specific task to make it easier for users to access the right set of icons.
Azure helps to build, manage, and deploy applications. You can also use your preferred languages, frameworks, and infrastructure—even your data center and other clouds—to solve challenges large and small. Its framework consists of five pillars:
Cost optimization
Operational excellence
Performance efficiency
Reliability
Security
When to use Azure Architecture Diagram Template
You can use the Azure Architecture Diagram Template to transform your data into actionable insights. Microsoft Azure has a wide range of use cases that it serves. Here you can see the most common examples:
Analytics
DevOps
Networks
Security
Databases
How to create an Azure Architecture Diagram Template
Here you can see some of the best practices when building your own Azure Architecture Diagram template.
Data comes from various sources. Use the Events Hubs icon for high volumes of data ingestion or the Storage Account icon for data uploaded to Blob Storage.
Use Azure Function App icon to signalize calls to the Text Analytics API icon.
Add Azure Database for MySQL icon after Function Apps.
Add Azure Machine Learning Studio icon to show data is being further analyzed for more insights.
Add the Power BI icon to show how MySQL Power BI provides options for data visualization and analysis in Power BI.
If you are interested in creating other network diagrams, Miro is the perfect network diagram tool with several available shape packs and templates to suit your needs.
How do I create an Azure Architecture Diagram Template?
Creating an Azure Architecture Diagram in Miro is easy. You can use our Azure Architecture Diagram Template and customize it as you see fit. Once you have the diagram structure, you can start adding the icons. You can find the icons under our Azure Icon Set integration.
Get started with this template right now.
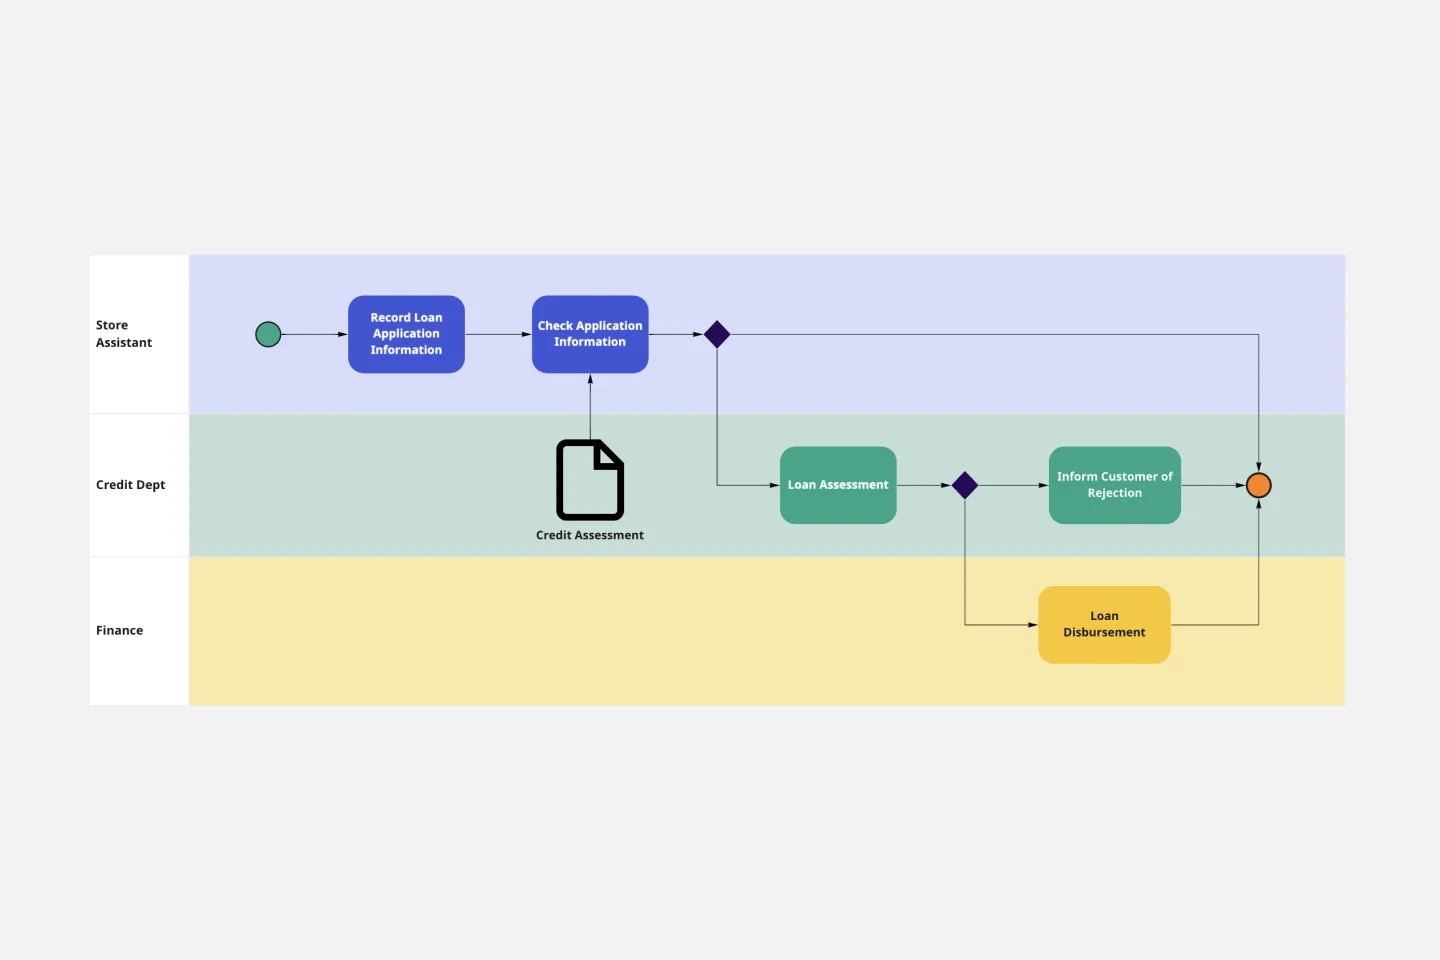
BPMN Template
Works best for:
Mapping, Diagrams, Business Management
The BPMN template helps you track and get an overview of your business processes. It’s a great way to identify any bottlenecks and make your operations more efficient. The BPMN methodology became a universal language when managing business processes, and multiple industries use it as a management tool. Project managers, business analysts, and IT administrators use the BPMN process flow diagram to manage projects, visually communicate the process flows, and keep track of process constraints. Try it for yourself and see improvements in your organization’s agility.
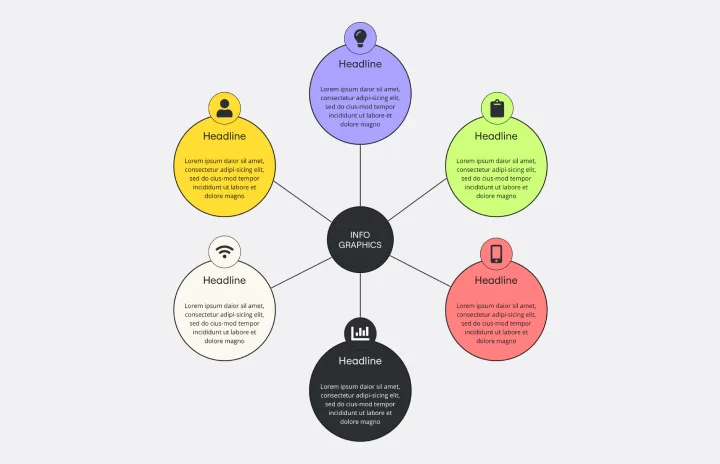
Web Diagram Template
Miro's Web Diagram Template simplifies complex project organization and promotes effective communication. It allows users to easily connect elements and gain a comprehensive understanding of complex relationships, making it a versatile and invaluable asset for diverse projects.
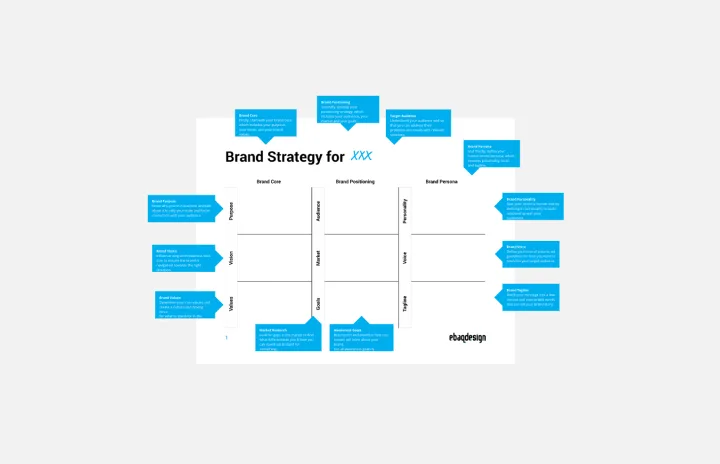
Brand Strategy Template
Works best for:
Marketing
Develop a brand strategy for new and existing brands with this fully guided Brand Strategy Template. Find new ways to build your brand and set your business up for success.
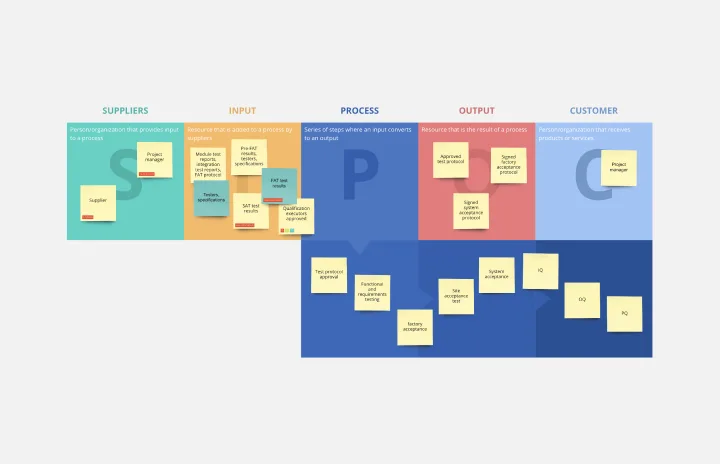
SIPOC Template
Works best for:
Agile Methodology, Strategic Planning, Mapping
A SIPOC diagram maps a process at a high level by identifying the potential gaps between suppliers and input specifications and between customers and output specifications. SIPOC identifies feedback and feed-forward loops between customers, suppliers, and the processes and jump-starts the team to think in terms of cause and effect.
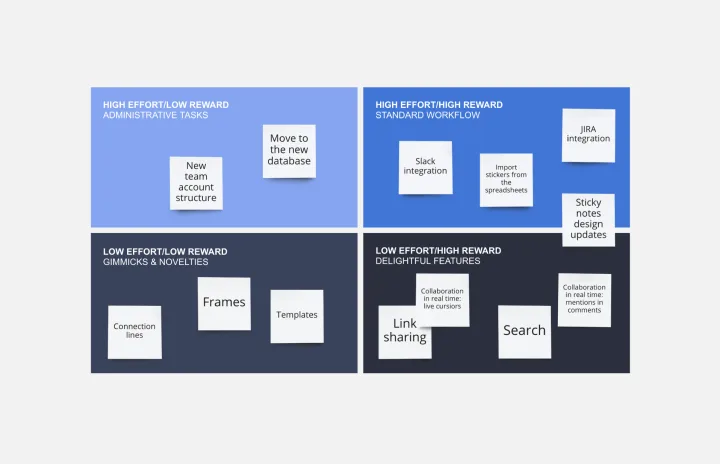
Cost-Benefit Analysis Template
Works best for:
Leadership, Decision Making, Strategic Planning
With so many day-to-day decisions to make—and each one feeling high-stakes—it’s easy for all the choices to weigh a business or organization down. You need a systematic way to analyze the risks and rewards. A cost benefit analysis gives you the clarity you need to make smart decisions. This template will let you conduct a CBA to help your team assess the pros and cons of new projects or business proposals—and ultimately help your company preserve your precious time, money, and social capital.
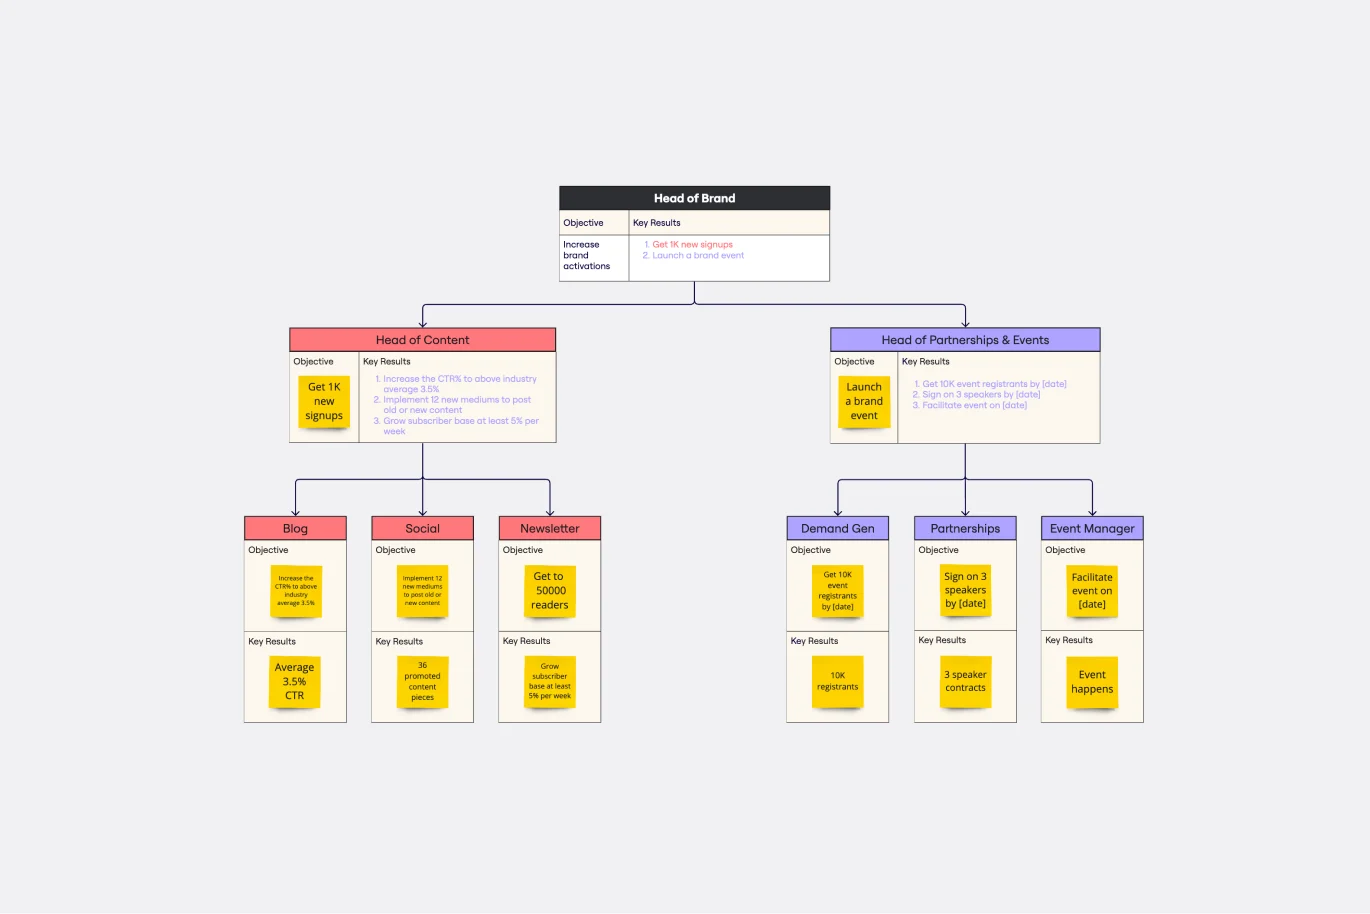
Objectives and Key Results (OKRs) Template
Works best for:
Leadership, Strategic Planning, Project Planning
Clarity, focus, and structure — those are the key ingredients to feeling confident in your company’s directions and decisions, and an OKR framework is designed to give them to you. Working on two main levels — strategic and operational — OKRs (short for objectives and key results) help an organization’s leaders determine the strategic objectives and define quarterly key results, which are then connected to initiatives. That’s how OKRs empower teams to focus on solving the most pressing organizational problems they face.