SIPOC Diagrams

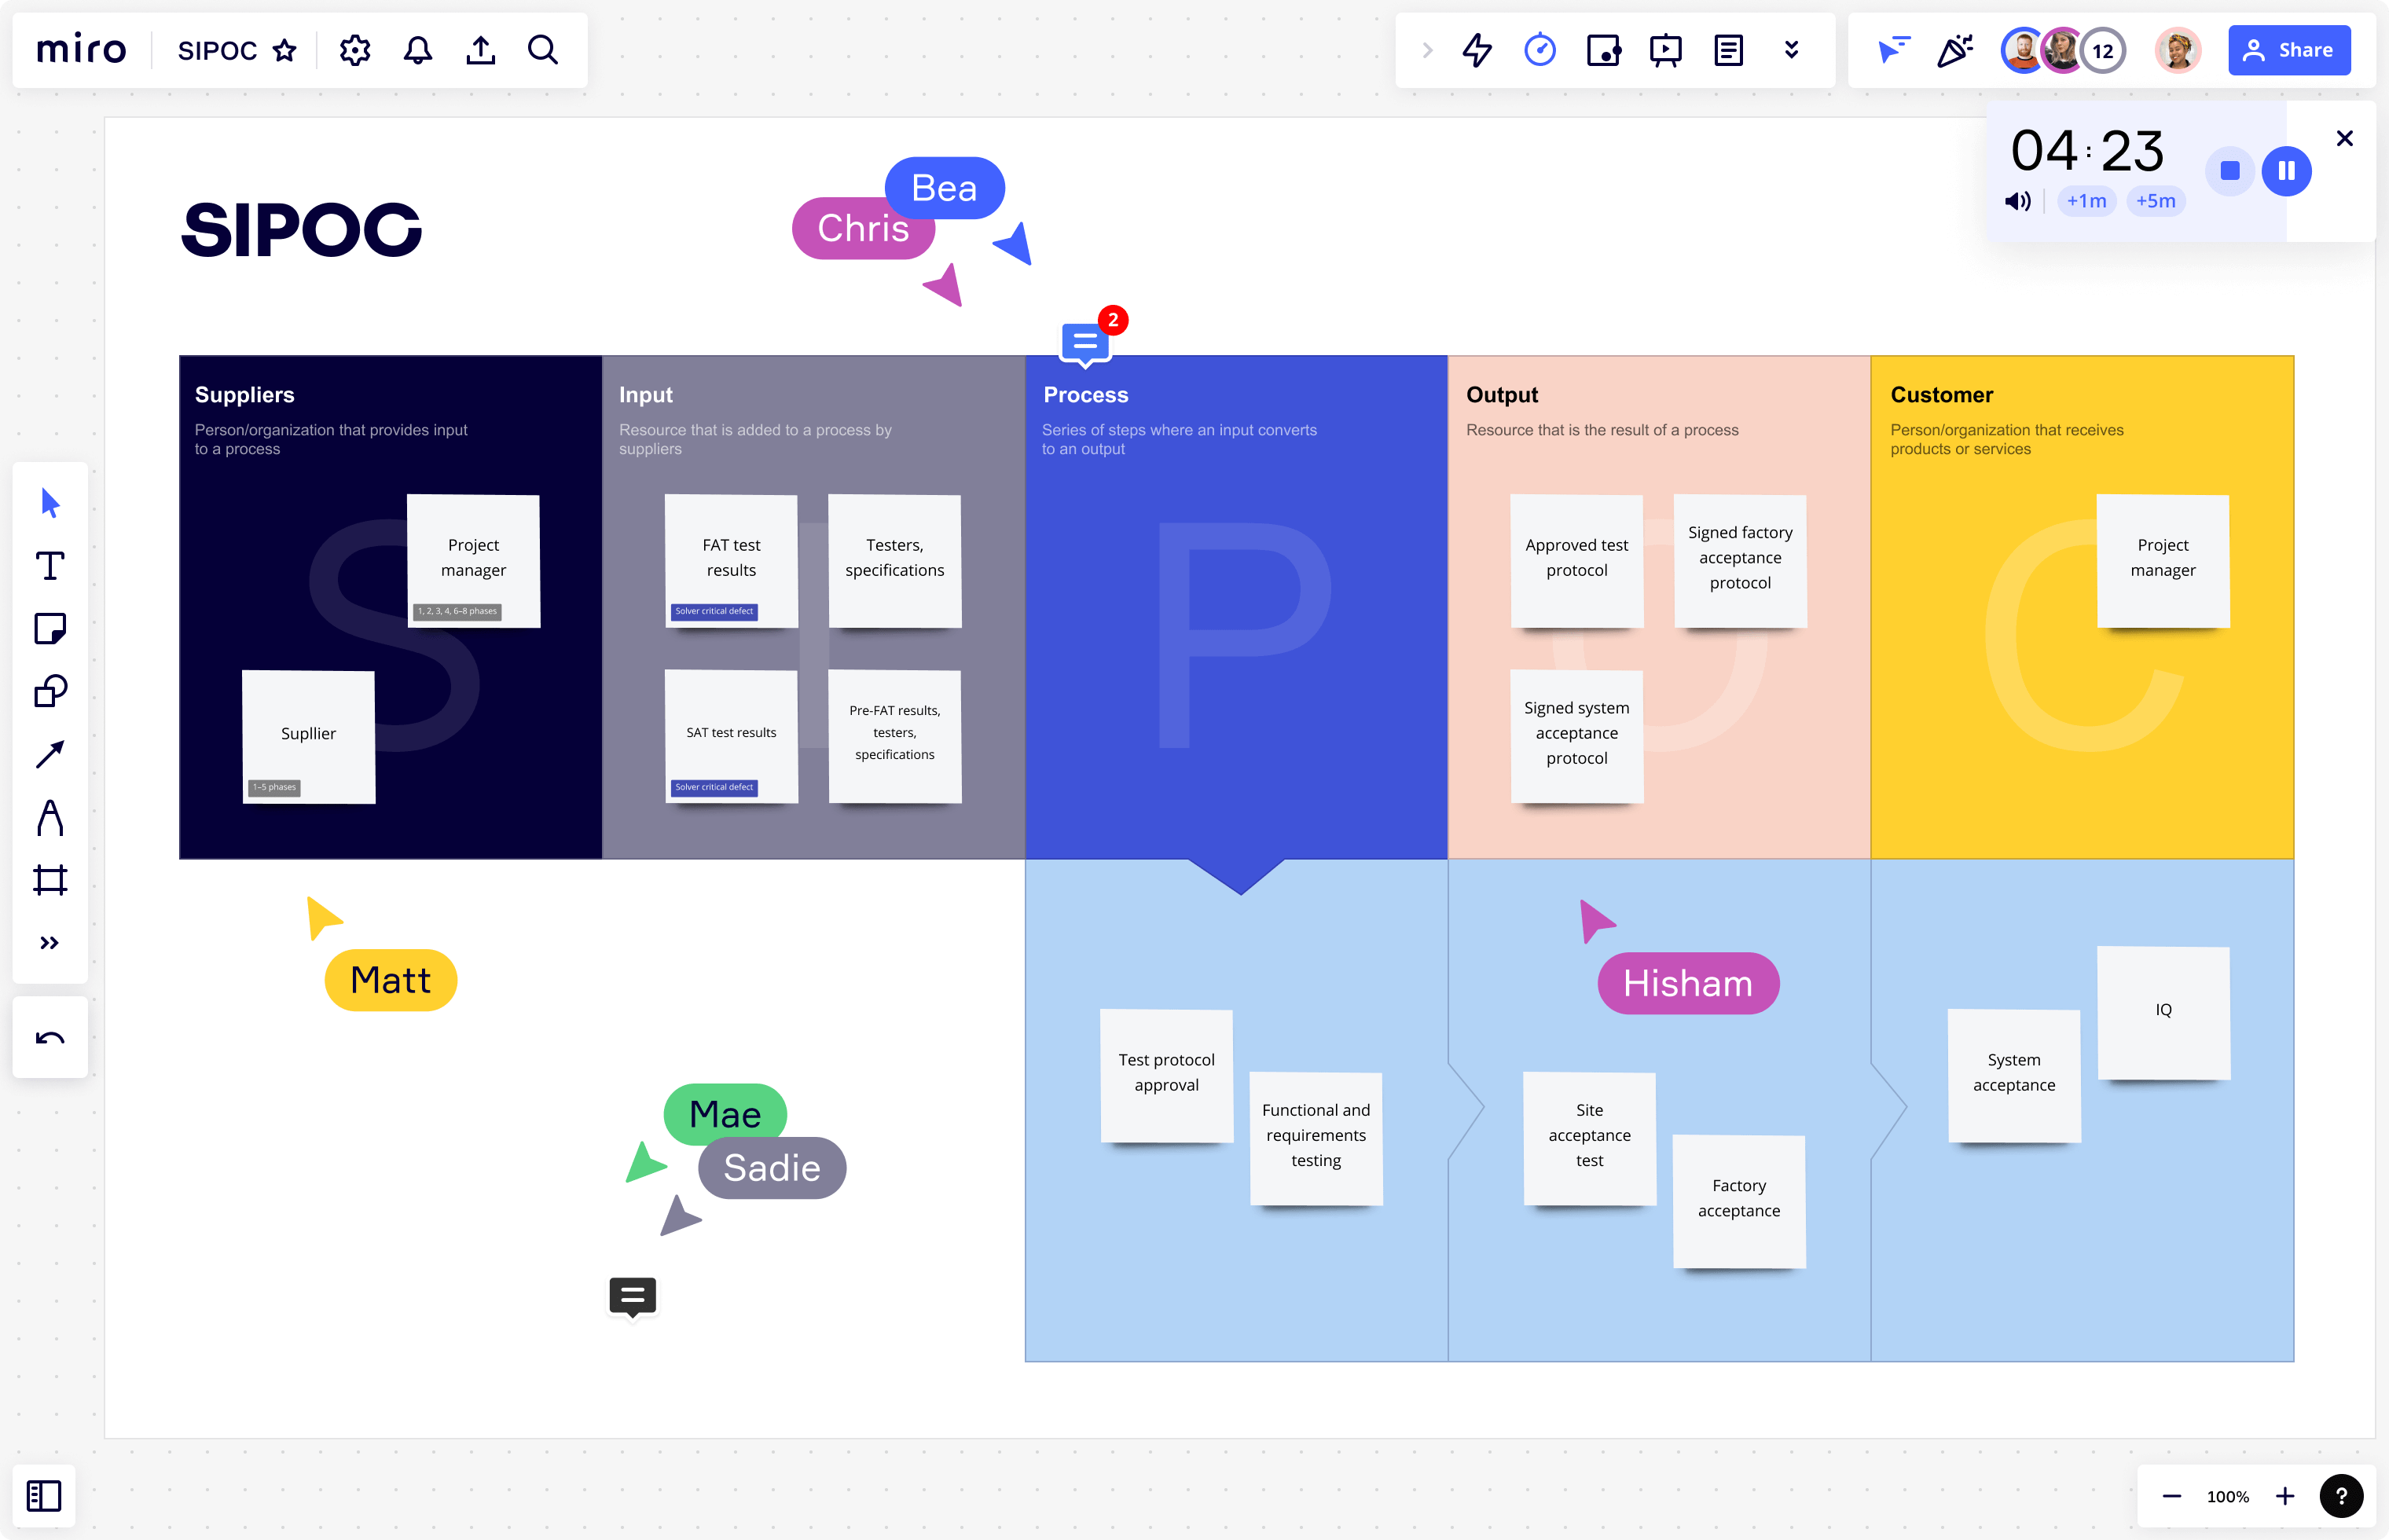
Table of Contents
Table of Contents
What is a SIPOC diagram?
In any organization, processes can get complicated. People may perform the same steps every day, but why use those steps? Are there people who depend on the results of the process? Is there a better way to get the job done?
In this article, you’ll learn how SIPOC diagrams can help you, find similarities with other process mapping techniques, and understand how Six Sigma practices use SIPOC. You’ll also find examples and a handy SIPOC diagram template.


A SIPOC diagram helps teams to understand all factors in the current state of a process. It is used before improvement starts on an existing process or before a new process is developed. A SIPOC diagram provides an overview of process activity, stakeholders, and outcomes. Defining these process elements encourages teams to think broadly about what is involved in business operations.
In business process improvement projects, SIPOC is used to define the factors of suppliers, inputs, processes, outputs, and customers. Six Sigma teams using the DMAIC method (define, measure, analyze, implement, control,) also use SIPOC in the define and measure phases to understand where to target improvement efforts. Sometimes Six Sigma includes SIPOC +CR, which means “SIPOC plus customer requirements,” and adds a Requirements column.
Diagramming these five areas provides a high-level overview of efforts, the ultimate goal, and true customers. Some consider a SIPOC analysis to be a type of value-stream analysis that captures the many factors contributing to end value. A value stream map, frequently used in Lean manufacturing, diagrams the activities that produce outputs.
What does SIPOC stand for?
The acronym SIPOC stands for: Suppliers, Inputs, Processes, Outputs, and Customers.
Suppliers
Suppliers include input sources such as individuals, companies, teams, information, or upstream processes. Note that some people consider customers as suppliers in some circumstances because they supply requirements information. This relationship is viewed as an information loop.
Inputs
Materials, human resources, items, or results of other processes form SIPOC inputs.
Processes
Processes are ordered activities that convert input into output. Processes can transform things, such as turning raw materials in manufacturing, construction, interior design, or cooking into a new valuable product. Processes can also be transactions, such as when insurance policies are purchased and processed.
Outputs
Outputs are the results of a process, such as goods, services, information, data, or even new inputs for the next step in a process.
Customers
The term customers broadly describes any person or entity that receives outputs, in other words, relevant stakeholders. In SIPOC, customers can be actual customers, teams, or downstream processes.
What are the benefits of a SIPOC diagram?
SIPOC diagrams bring transparency when a project’s scope is ill-defined. With this visual tool, people can easily see the end-to-end process.
A SIPOC map provides an at-a-glance view that all team members can refer to as needed. Creating a SIPOC diagram aligns teams on who benefits from a process and how a process works. The visual format also provides a tidy overview when explaining a process to someone unfamiliar with the activity.
For executives, SIPOC charts provide a high-level process map for understanding activities, the actors that support them, and the final output that results from these activities.
Gaining a clear understanding of how the parts of an operation work together can be beneficial at the start of a new process or business. Use SIPOC diagrams for business analysis to understand the role of developers, stakeholders, and others.
These diagrams identify the flow of information, materials, outputs from other processes, and any other pertinent inputs, and help you find and eliminate waste and redundancy and clarify the value chain.
SIPOC diagrams also help identify who supplies inputs and input specifications. Even more importantly, use a SIPOC diagram to pinpoint customers and their requirements — in other words, understand how your process serves customers.
Working through a SIPOC analysis shows what is relevant to a process and surfaces process gaps. SIPOC diagrams also show the current processes before teams make changes. Consider creating a SIPOC diagram before you add detailed steps to your process workflow.

Example of a SIPOC diagram
For an example of a SIPOC diagram in action, here are the components for a diagram of creating a blog post for a company site. In this organization, the art department creates images before everything is sent to the editor.
But what if many images are sent back for text or content edits? Should the art go to the editor first? A SIPOC analysis can help us understand the possible steps in a new process.
Suppliers: Writer, editor, graphic artists, template makers
Inputs: Ideas, books, magazines, the Web, pencils, paper, tablets, laptops, tables, chairs
Process: Writer receives assignment > Writer writes draft > Writer requests custom art from artist > Artist creates images > Editor reviews images and content in the article
Outputs: Images, article
Customers: Web production department, editorial department, the company that owns the website, the potential leads drawn in by the article
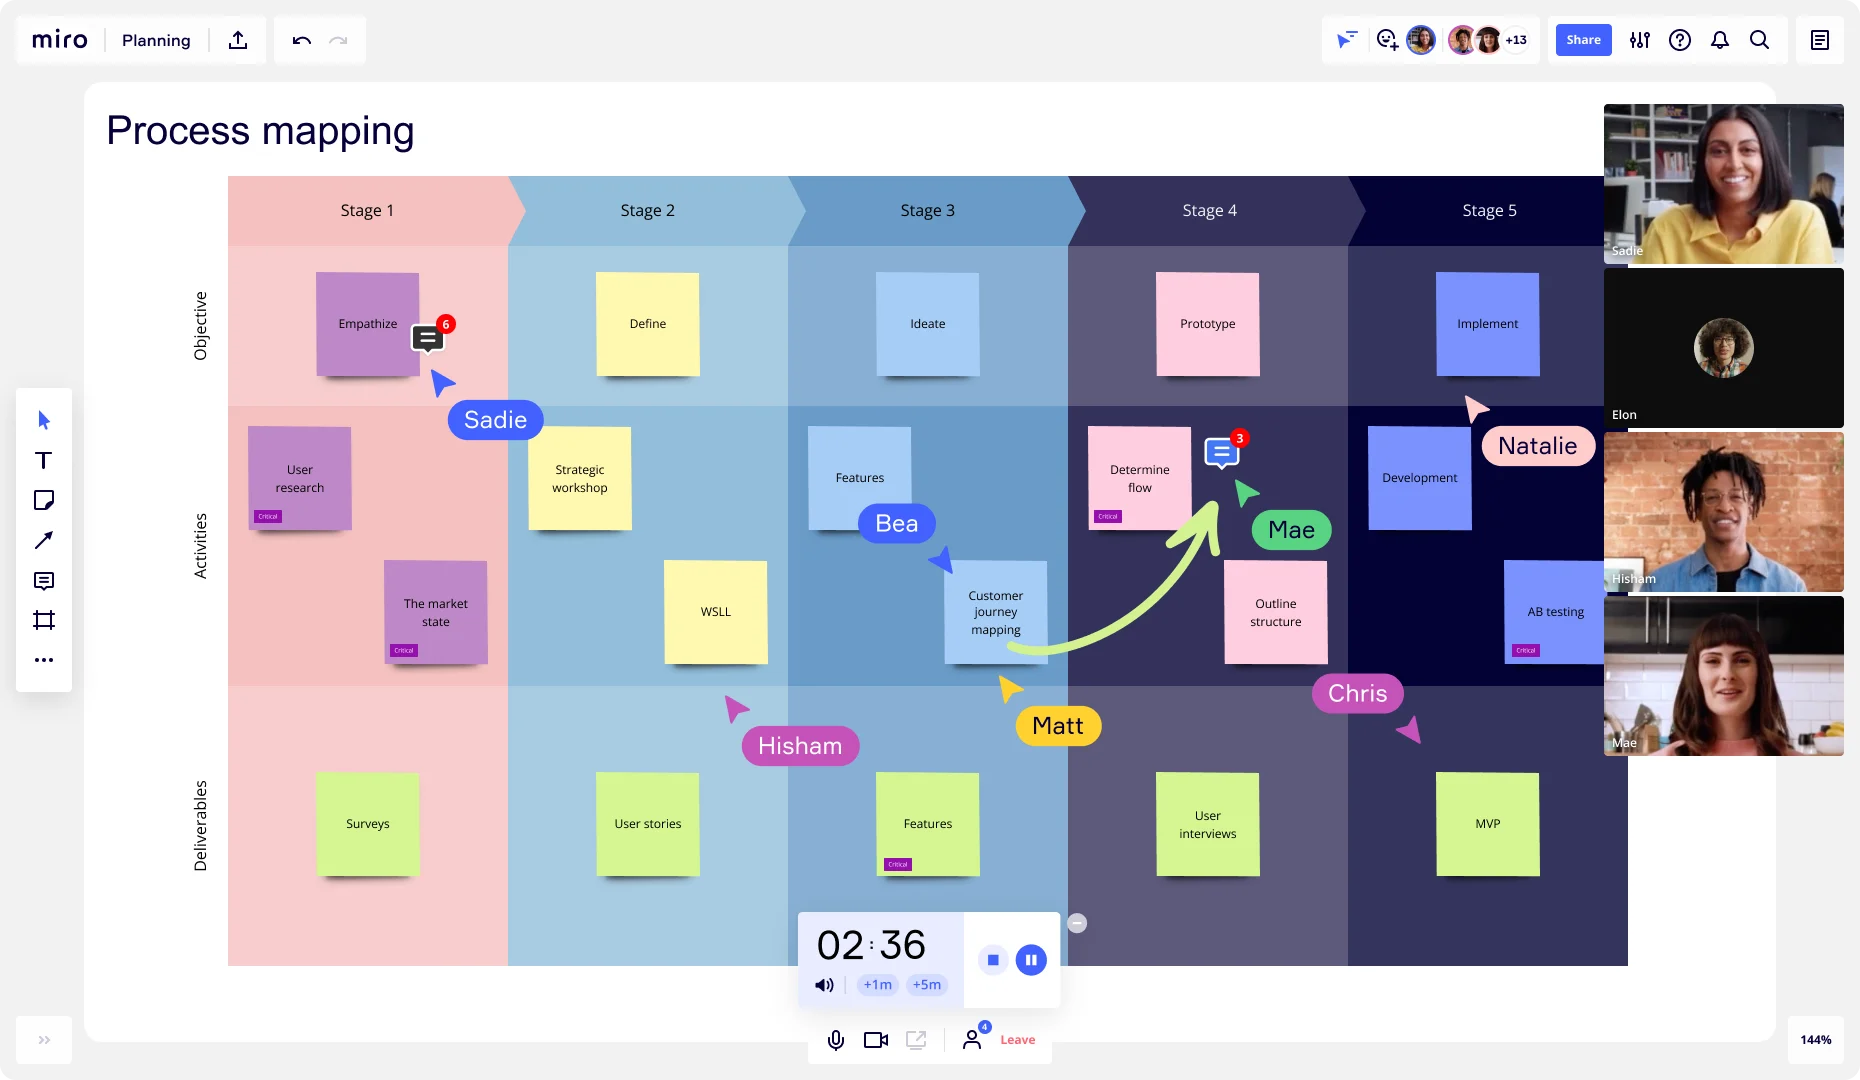
How to create a SIPOC diagram
Creating a SIPOC diagram can be done collaboratively as a team. Here are the key steps in making a SIPOC diagram:
1. Start with the process that adds value
Before you begin, be sure to clearly label which processes you're diagramming to reduce confusion and uncertainties.
You'll want to have a clear understanding of the start and end points of your process before you go any further. Finding the start and finish should be easy for existing processes, but don’t underestimate the possibilities for disagreement about where processes begin and end. Because they are continuous, people may have different opinions about terminal points.
When designing future processes, people should take their best guess about what steps will be needed. To keep it manageable, aim to limit the process to 4-5 high-level steps.
2. Determine the key outputs of the process
To determine this, ask the following questions: What products, services, or information does the process create? Did this process create these outputs? Could another process have created them?
Narrow your choices to the three primary process outputs. Use nouns to describe the outputs without adding modifiers or value judgments.
3. Define your customers
Remember, in SIPOC, “customers” are the people or entities that benefit from the outputs, including literal customers, other departments, or processes that receive output. Customers can also be external and internal. In other words, customers are stakeholders. Consider adding any output requirements they specify.
4. List the process inputs
Inputs include anything that supports the process. Try to limit the list to 4-6 main inputs. The following are examples of process inputs:
Tools
Materials
Buildings
Employee roles
Equipment
Utilities
Services
Information
5. Identify the input suppliers
Suppliers can also be internal or external. For example, an external designer might create a stylesheet for a new website, but an in-house developer might hook up the user interface with the backend payment processing capability.
Best practices for creating a SIPOC diagram
Here are some best practices for getting the most benefit from creating a SIPOC diagram:
Gather the team in person or virtually
Creating a SIPOC diagram is a collaborative effort. What’s more, include the people who perform the processes. They are the real experts. For new processes, include your sponsors so they understand the implications of business choices.
Limit the number of items in each SIPOC category
More complex ideas can be added to a parking lot on your whiteboard for future consideration.
Keep things high level
Usually, teams define the process and move through output, customer, input, and suppliers first. However, consider starting with the customer analysis to explore the value added in an analysis approach called COPIS (or SIPOC written backward). Another approach identifies the process first and the customer second. Yet another method includes the top 3-5 customer requirements.
Get feedback on your diagram
Share the compiled SIPOC diagram with project sponsors and other stakeholders to get their assessment before implementing any process changes.
Clarify any unknowns
Resist the drive to change processes until you understand them. SIPOC mapping helps you gain clarity on processes.
As helpful as SIPOC diagrams can be for achieving agreement among stakeholders about how things work, you may still need other tools to complete your process improvement. When SIPOC charts provoke questions, look at other tools like the 5 Whys analysis.
Get on board in seconds
Join thousands of teams using Miro to do their best work yet.