Value Chain Analysis Template
Understand the value your business has delivered to your customers with the value chain analysis template.
Trusted by 65M+ users and leading companies


About the Porter’s Value Chain Model (aka Value Chain Analysis template)
Commonly known as the Value Chain Analysis, Porter’s Value Chain Model is a much-used method to evaluate a business’s competitive edge and improve processes to have fewer bottlenecks and add more value to your customers.
What is a value chain analysis template?
A value chain analysis template includes a set of activities a company performs to deliver a valuable product from start to finish. The analysis allows your team to visualize all the business activities involved in creating the product — and helps you identify inefficiencies, bottlenecks, and miscommunications within the process.
Create your own value chain analysis template
Getting started with your team’s value chain analysis template is easy with Miro. Simply click “Use Template” and take the following steps to customize it for your own value chain analysis template:
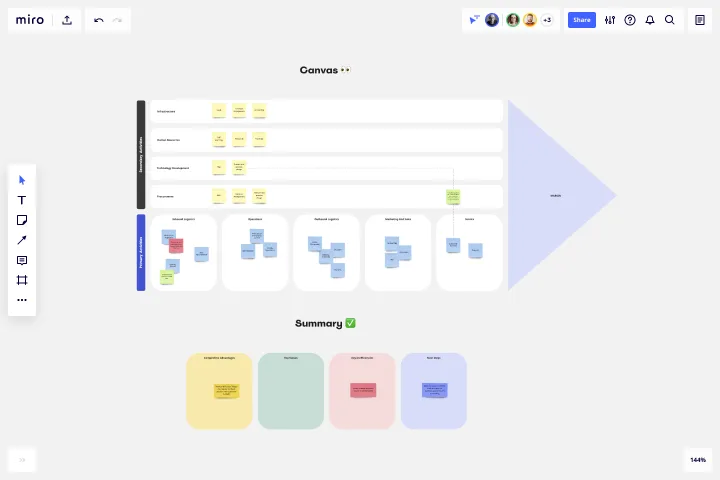
Step 1: Replace the canned text in the orange squares and blue lines with your business’s specific primary and support business activities.
Step 2: Use sticky notes to map out the process for each business activity.
Step 3: Identify where bottlenecks occur and find areas where you can maximize value and gain a competitive advantage.
Make sure to consider using Miro's Value Stream Mapping tool during this process. This framework can help improve the efficiency of a specific process, which can then be integrated into a broader Value Chain Analysis to optimize the overall value delivery of the organization.
Benefits of using a value chain analysis template
First coined by Harvard Business School professor Michael Porter, Porter’s Value Chain Model helps your team evaluate your business activities so you can find ways to improve your competitive advantage. The value chain analysis will also help you determine costs, find activities that add the most value, outshine your competitors, and improve the value of what you deliver to your customers.
Building a product can be costly in terms of both time and resources. Even worse, it can be almost impossible to know whether a process works until after you’ve tried it. Porter’s Value Chain Model helps you visualize more complex or intangible processes.
Every business should perform this analysis at some point. Your team can do this anytime you want to improve your competitive advantage taking the following steps:
Define your business’s primary activities (e.g. logistics, operations, marketing).
Define your business’s support activities (e.g. HR, infrastructure, tech).
Analyze the cost and value of each.
Discover opportunities that allow you to gain a competitive advantage.
How do you draw Porter's value analysis?
You can build your Porter’s Value Chain Model following these steps: - Map all activities involved in producing your product - Calculate the cost of each activity - Find out what do your customers perceive as value - Check competitors Porter’s Value Chain Model and benchmarks - Choose what’s your competitive advantage and where will you capitalize
How do you analyze a value chain?
After building your value chain analysis template, you can evaluate the links between each activity and its values. This value chain analysis is particularly crucial when increasing competitiveness as it will determine how to proceed to improve processes.
How do you write a value chain analysis?
You can write your value chain analysis determining which activities are to be optimized. The analysis should include quantitative and qualitative data to help you develop action points to increase your product’s added value and customer base. After your value chain analysis is ready, you can draw a business case to implement changes and help you prioritize.
Get started with this template right now.
Problem Tree Template
Works best for:
Strategy & Planning
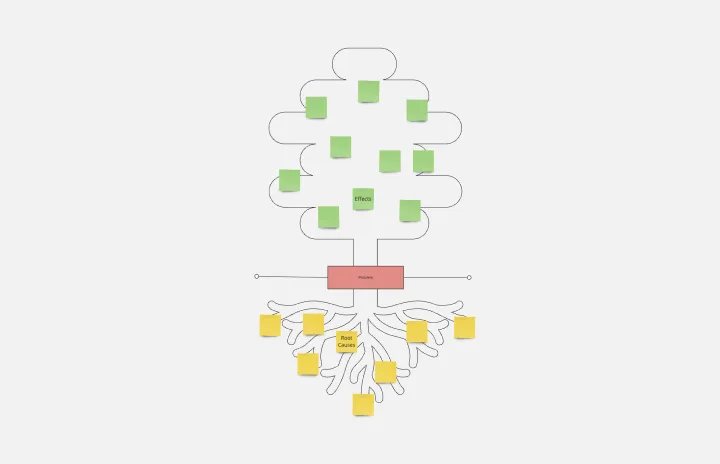
The Problem Tree Template is a visual tool crafted to examine a primary issue, its consequential effects, and its foundational causes. Picture it: The tree's trunk embodies the central dilemma, its branches display the direct ramifications, and the roots delve into the underlying reasons. By organizing a challenge in such an illustrative manner, users can comprehensively grasp their situation.
OKR Planning Template
Works best for:
Strategic Planning, Meetings, Workshops
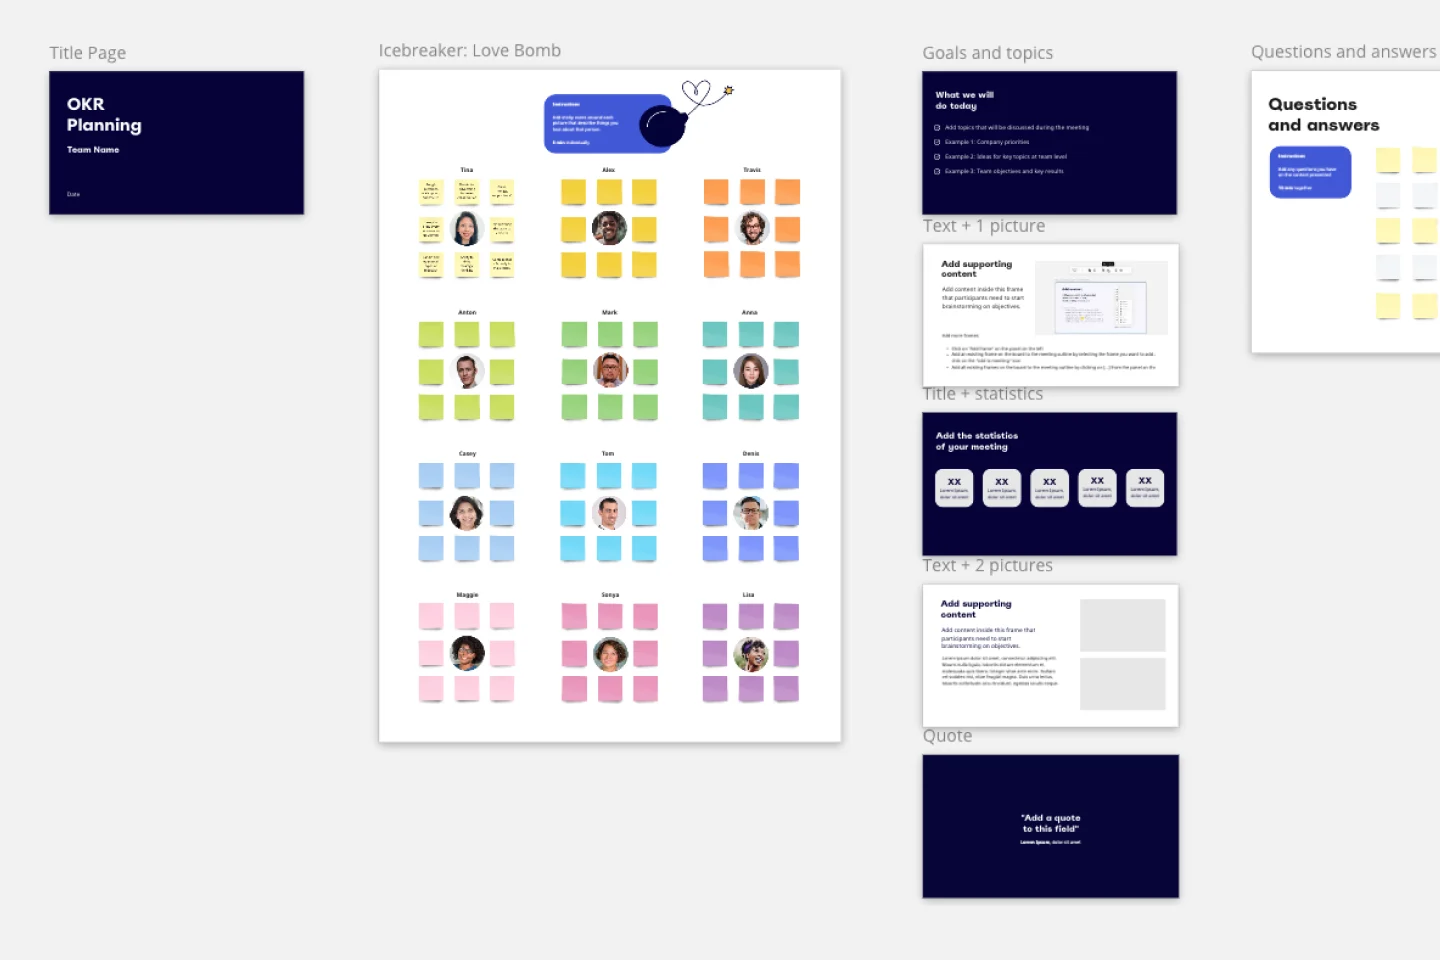
The OKR Planning template helps you turn exhaustive OKR sessions into dynamic and productive meetings. Use this template to make OKR planning more interactive, guiding your team through the session with creative Ice Breakers and Brainstorms, so you can co-create your OKRs and define the key results and action plans to achieve them.
5W1H Template
Works best for:
Strategy & Planning
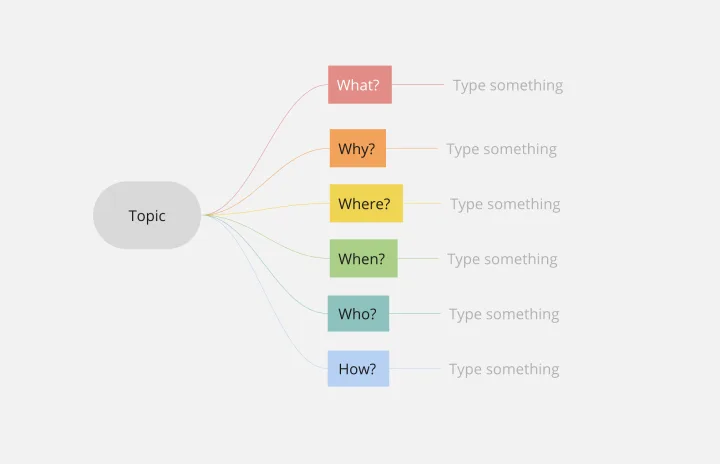
The 5W1H Template is a strategic framework that clarifies complex situations or projects into six foundational questions: What, Who, Where, When, How, and Why. This methodological approach ensures a comprehensive understanding, encouraging teams to dissect and explore every aspect of a given challenge or project.
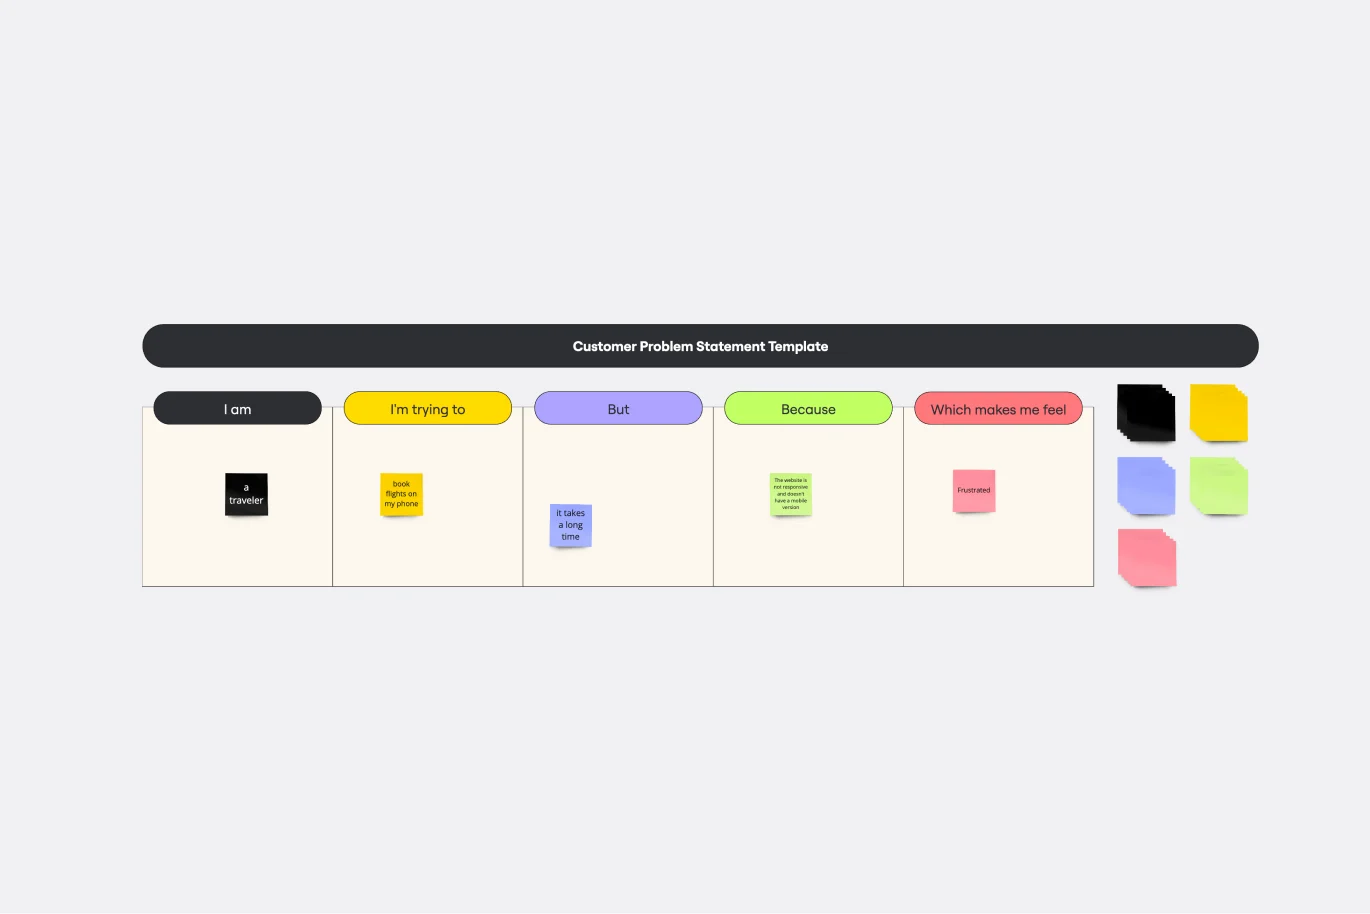
Customer Problem Statement Template
Works best for:
Ideation, Design Thinking, Product Management
Put yourself in the shoes of your consumers with a customer problem statement. Figure out their problems and how your product or service can solve those problems and make their lives easier. As a bonus, you’ll better understand your customers throughout the process.
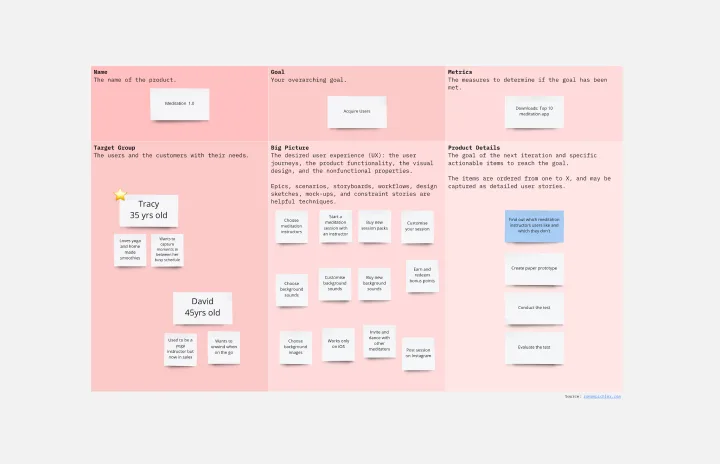
Product Canvas Template
Works best for:
Desk Research, UX Design
Product canvases are a concise yet content-rich tool that conveys what your product is and how it is strategically positioned. Combining Agile and UX, a project canvas complements user stories with personas, storyboards, scenarios, design sketches, and other UX artefacts. Product canvases are useful because they help product managers define a prototype. Creating a product canvas is an important first step in deciding who potential users may be, the problem to be solved, basic product functionality, advanced functionalities worth exploring, competitive advantage, and customers’ potential gain from the product.
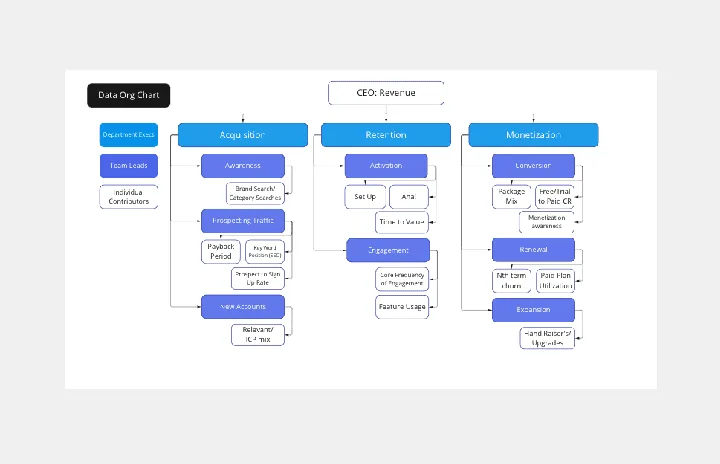
Data Org Chart
Works best for:
Org Charts, Operations, Mapping
Succeed with your data-driven culture by creating a data 'org chart'.