UML Diagram Template
Model and design software at ease. With Miro’s UML diagram template, your team can visualize processes, development, and behavior with a unified language.
Trusted by 65M+ users and leading companies


About the UML Diagram Template
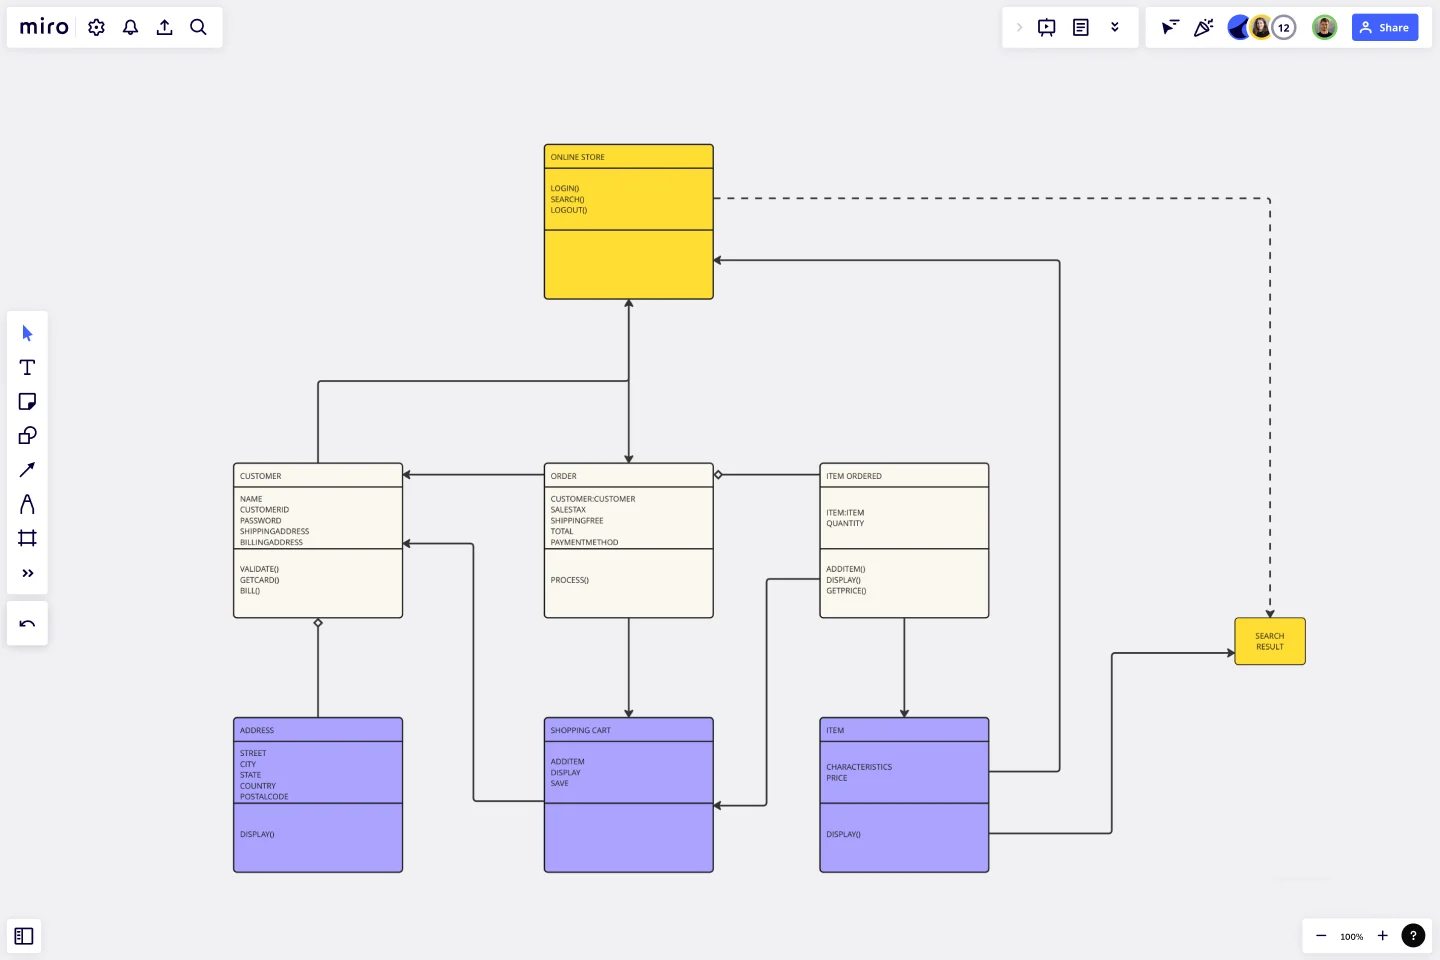
Miro’s UML diagram template is a free and customizable visual tool for mapping out step-by-step processes and visualizing software systems. UML, which stands for Unified Modeling Language, was initially used as a modeling language in software engineering, but it’s now a widely used approach to diagramming application structures, modeling, and documenting software. Professionals from various sectors use UML diagrams to model business processes and workflows.
We’ll walk you through how to use Miro’s UML diagram template and share more about its benefits.
How to create a UML diagram using Miro’s template
To open Miro’s UML diagram template, click on the blue “use template” button on this page. Once you’re in, here are a few steps you can take to start filling the template in and making it your own:
1. Identify your target audience
When deciding which type of UML diagram best fits your needs, start by choosing your target audience. For example, executives are probably only interested in the big picture, while developers need as much detail as possible. Knowing who you’re targeting will inform how much information to add to the UML diagram template.
2. Label the shapes
Once you’re ready to populate the UML diagram template, double-click on the shapes to add text. The shapes are divided into three color sections, allowing you to establish a hierarchy among the content you’re adding. Duplicate or remove these shapes as needed.
3. Rearrange the connection lines
The UML diagram template comes with connection lines, allowing you to depict the relationship between the shapes. Drag them around to adjust the order you want your shapes to appear. Duplicate or remove any lines as needed.
4. Customize the template
Change up shape sizes, colors, arrow directions, and line styles to customize the look and feel of your UML diagram template. You can also use color to indicate important information you’d like to draw your audience’s attention to.
Advantages of using a UML diagram template
Like flowcharts, UML diagrams can provide your organization with a standardized method of mapping out step-by-step processes. They allow your team to view the relationships between systems and tasks easily. Though they were originally for software engineers, UML diagrams have become popular in other industries too for their ability to simplify the system design process.
Using Miro’s UML diagram template makes it easy for your team to visualize complex systems by saving you time from having to build a diagram from scratch. Plus, between our UML diagramming shape pack, intuitive drag-and-drop interface, and powerful collaboration features, you’ll create a clear and visually compelling UML diagram in no time.
Need to make changes after you’re done? You can easily edit your UML diagram template over time, allowing you to keep your content fresh and up to date.
Is Miro’s UML diagram template free?
Yes, Miro’s UML diagram template is free and ready to use, though you’ll need a Business, Enterprise, or Education plan to access the full UML shape pack. Visit our Help Center to learn more about accessing different shape packs.
When to use a UML diagram template
You can use a UML diagram template to model software development by helping design and analyze the software, besides guiding development and team prioritization. They have become a popular way to model business processes or workflows. UML diagrams are an effective tool that can help you bring various stakeholders up to speed, create documentation, organize your workplace and team, and streamline your projects.
Can you draw various UML diagrams with Miro?
Yes. Miro is a visual workspace for innovation, allowing you to customize UML diagrams according to your needs and audience. The UML diagrams are mainly divided into two categories: structural and behavioral. 14 UML diagram examples are split into these two categories, and you can use Miro’s features to design for both.
Get started with this template right now.
Swim Lane Diagram with Data
Works best for:
Flowchart, Mapping, Diagrams
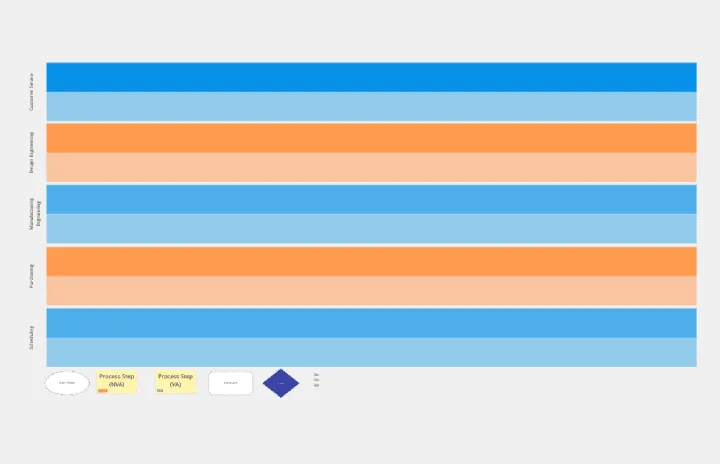
The Swim Lane Diagram with Data template is a visual tool for illustrating processes or workflows with swimlanes that contain additional data or information. It provides elements for documenting process steps, timelines, and performance metrics within each swimlane. This template enables teams to analyze process efficiency, identify bottlenecks, and make data-driven decisions for process improvement. By combining visual clarity with data insights, the Swim Lane Diagram with Data empowers organizations to optimize workflows and drive continuous improvement effectively.
Pros and Cons List Template
Works best for:
Decision Making, Documentation, Strategic Planning
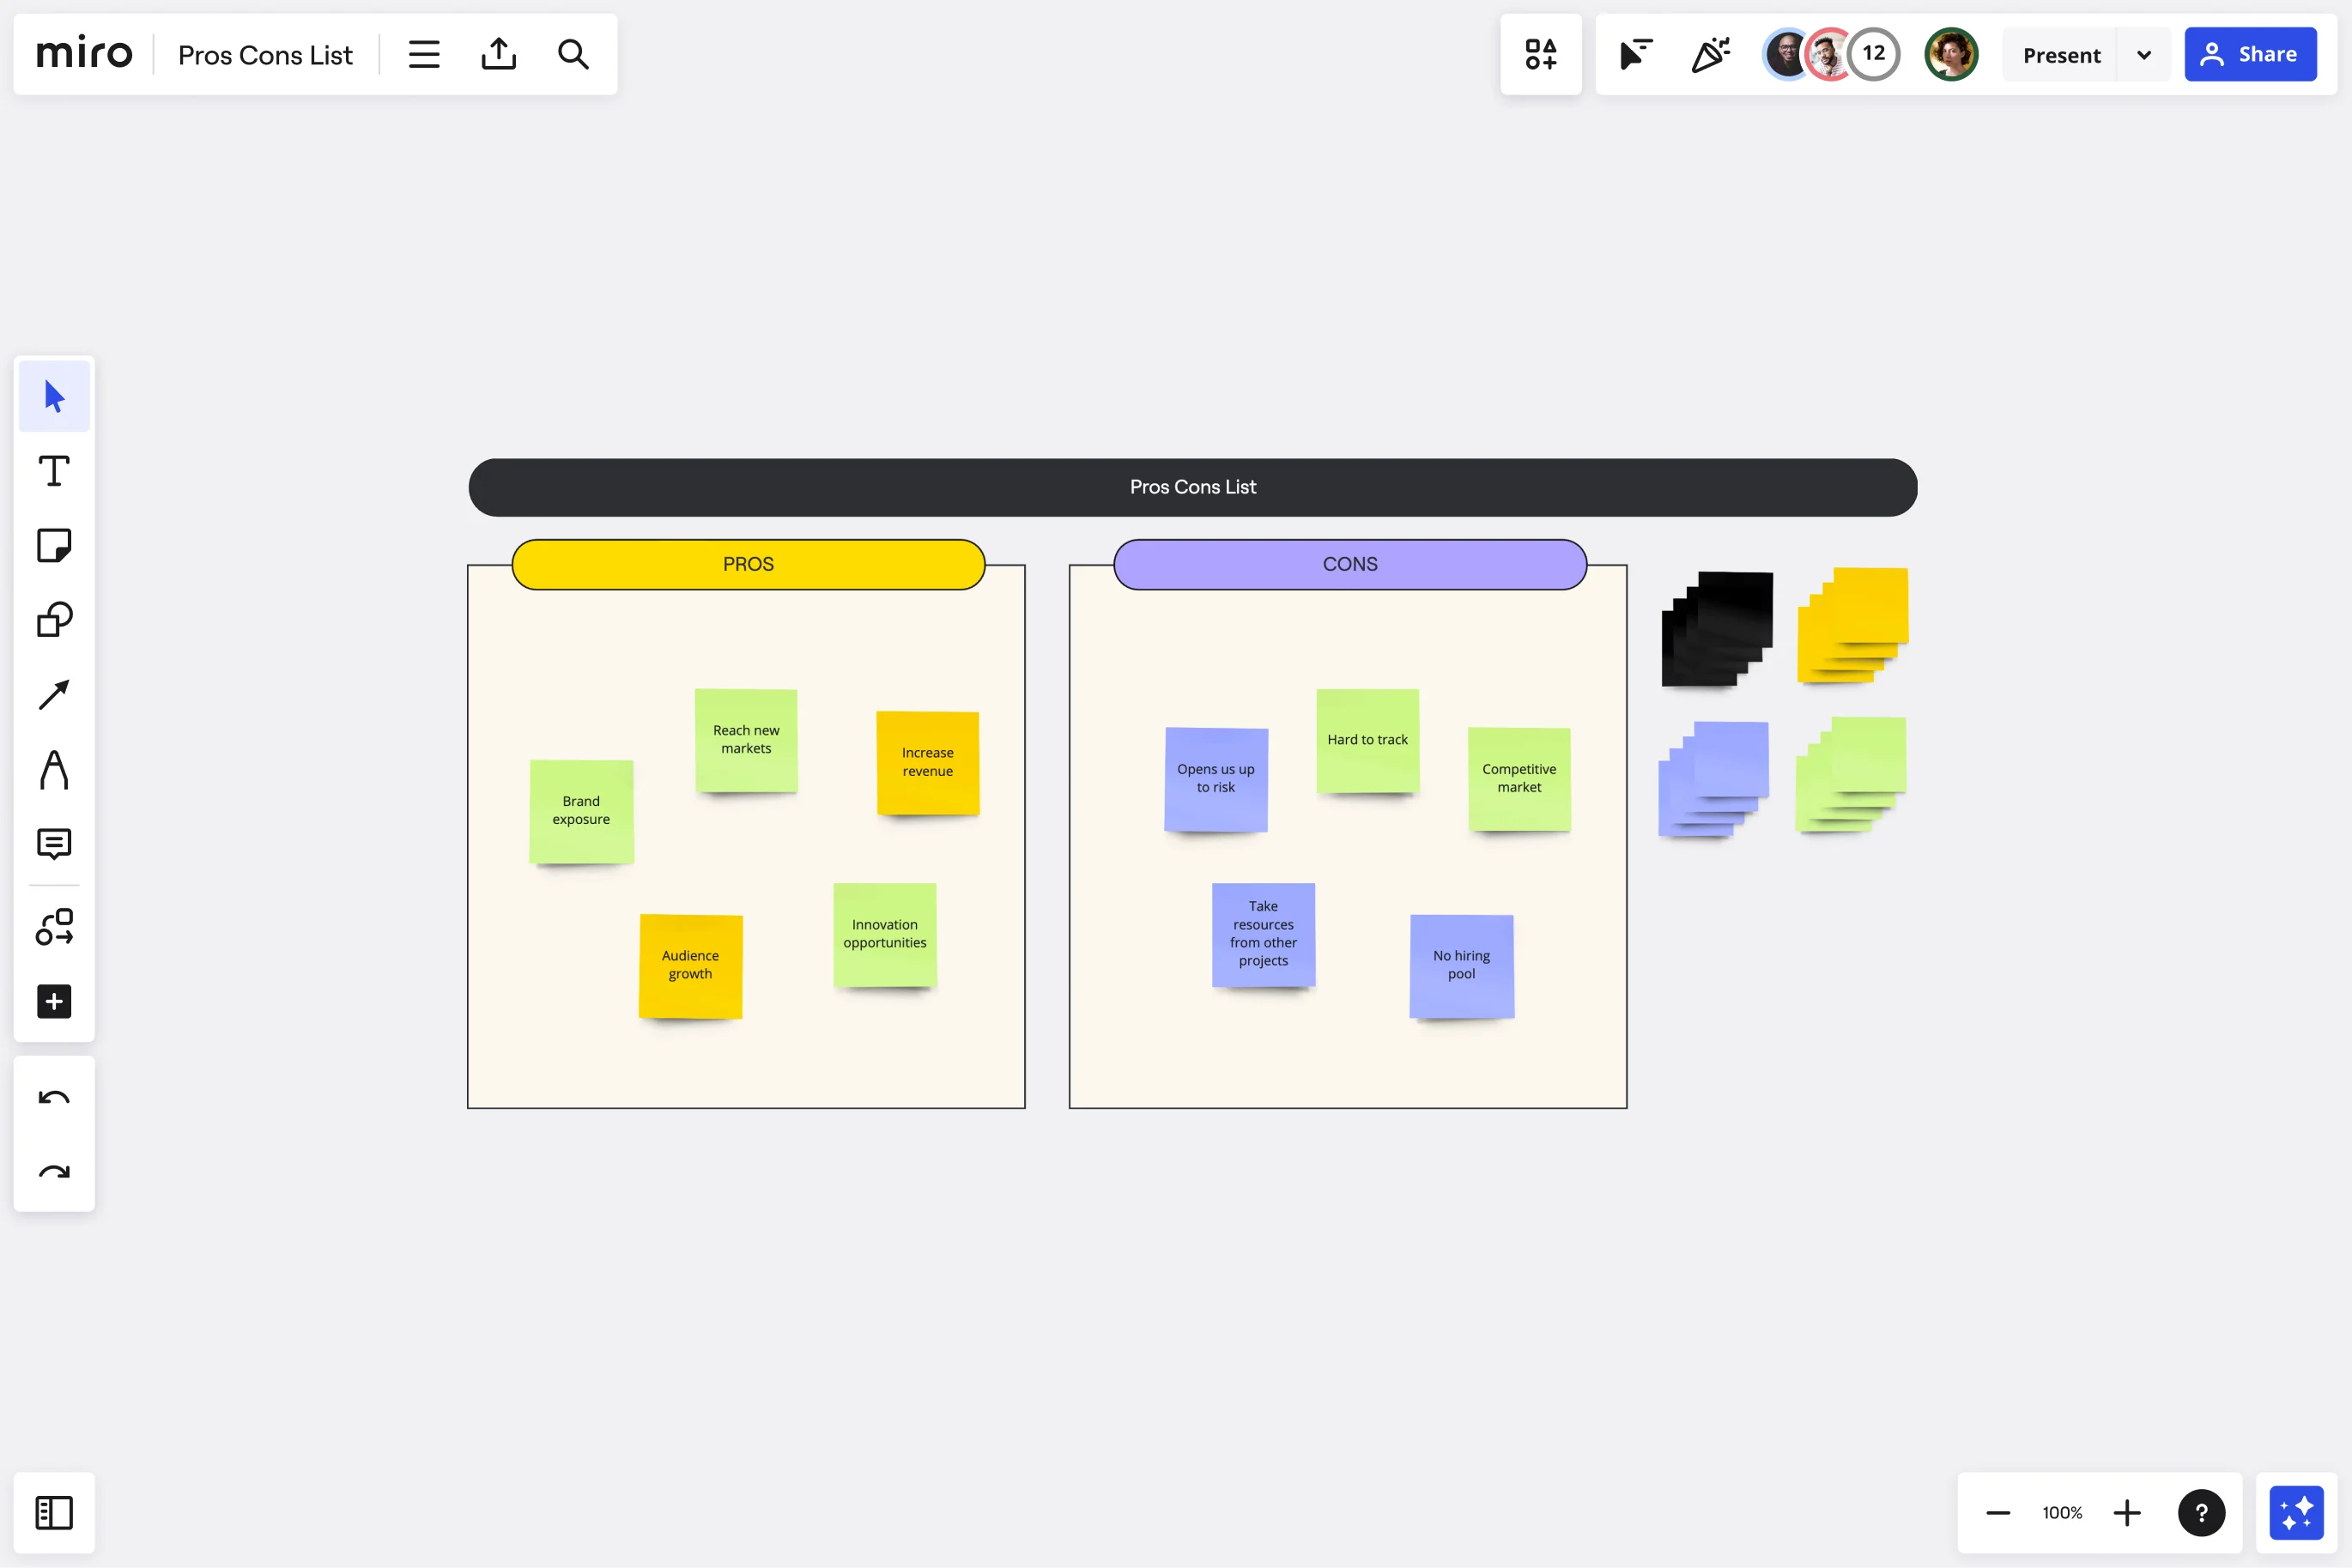
A pros and cons list is a simple but powerful decision-making tool used to help understand both sides of an argument. Pros are listed as arguments in favor of making a particular decision or action. Cons are listed arguments against it. By creating a list that details both sides of the argument, it becomes easier to visualize the potential impact of your decision. To make your pros and cons list even more objective, it can help to weight each pro and con against the others. You can then present your decision with confidence, making a strong argument for why it’s the right one.
Risk Assessment Template
Works best for:
Leadership, Project Management, Decision Making
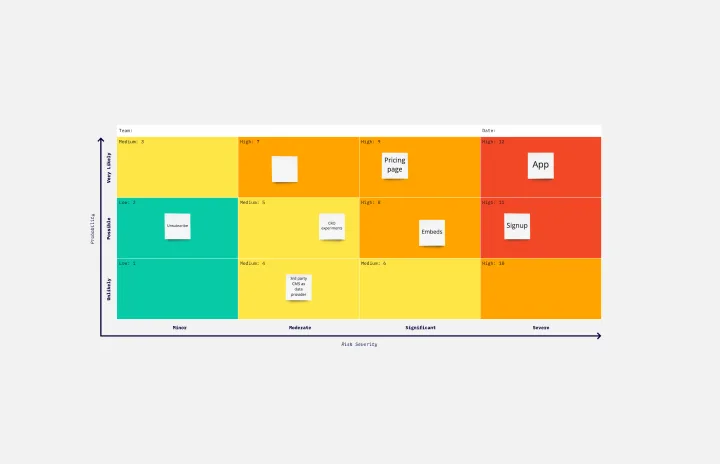
Every business faces risk. The more you factor it into your decisions early on, the better prepared you’ll be to avoid, absorb, or mitigate the risks you encounter. Use Miro’s risk assessment template to collaborate on a clear-eyed risk assessment that ensures you’ll never be caught unawares.
Wardley Mapping Canvas Template
Works best for:
Leadership, Strategic Planning, Mapping
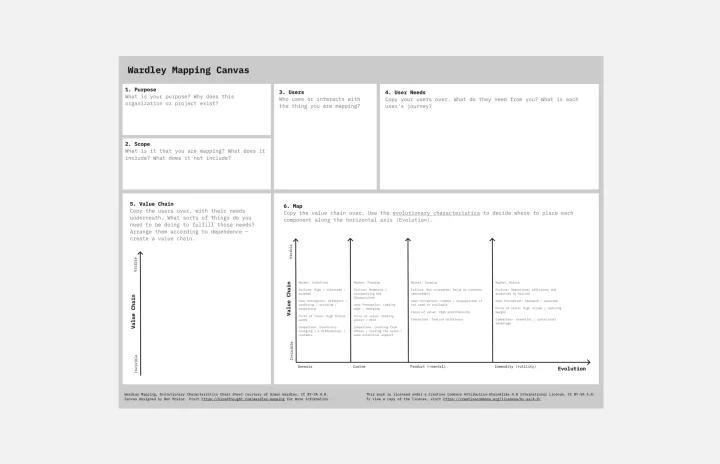
A Wardley Map represents the landscape in which a business operates. It's made up of a value chain (the activities required to fulfill user needs) graphed against the evolution of individual activities over time. You place components with value on the y-axis and commodity on the x-axis. Use a Wardley Map to understand shared assumptions about your environment and discover what strategic options are available. Easily communicate your understanding of the landscape to your team, new hires, and stakeholders.
Agile Board Template
Works best for:
Agile Methodology, Meetings, Agile Workflows
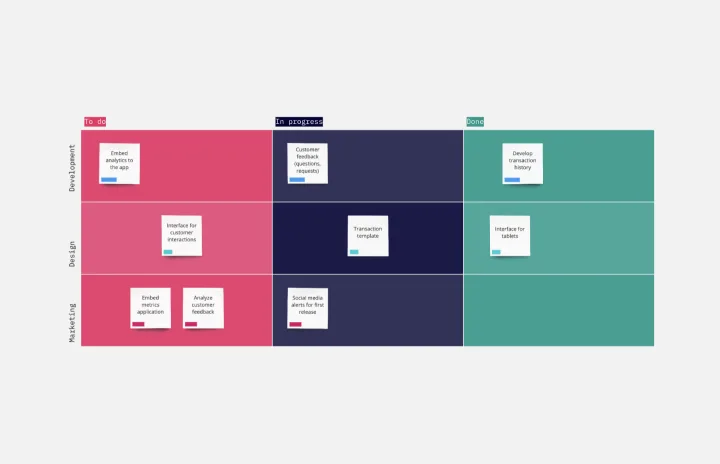
Part of the popular Agile framework, an Agile Board is a visual display that allows you to sync on tasks throughout a production cycle. The Agile Board is typically used in the context of Agile development methods like Kanban and Scrum, but anyone can adopt the tool. Used by software developers and project managers, the Agile Board helps manage workload in a flexible, transparent and iterative way. The Agile template provides an easy way to get started with a premade layout of sticky notes customizable for your tasks and team.
Fishbone Diagram Template
Works best for:
Operations, Diagrams, Workflows
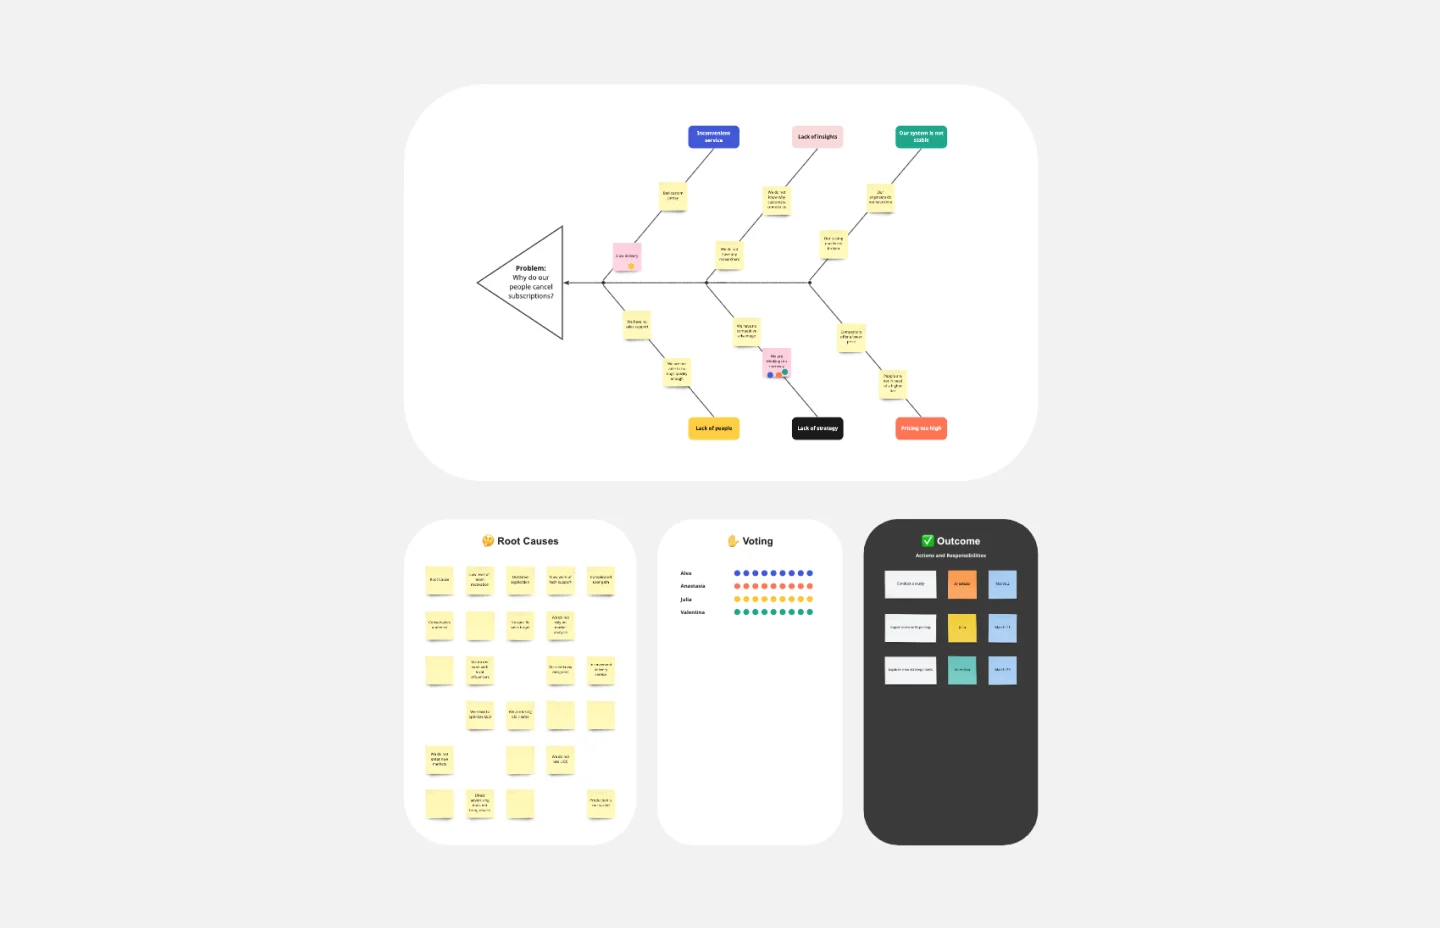
What is the best way to solve any problem your team faces? Go straight to the root. That means identifying the root causes of the problem, and fishbone diagrams are designed to help you do it best. Also known as the Ishikawa Diagram (named after Japanese quality control expert Kaoru Ishikawa), fishbone diagrams allow teams to visualize all possible causes of a problem, to explore and understand how they fit together holistically. Teams can also use fishbone diagrams as a starting point for thinking about what the root cause of a future problem might be.