Impact Mapping Template
Set business goals and outline how to achieve them.
Trusted by 65M+ users and leading companies


About the Impact Mapping template
What is Impact Mapping?
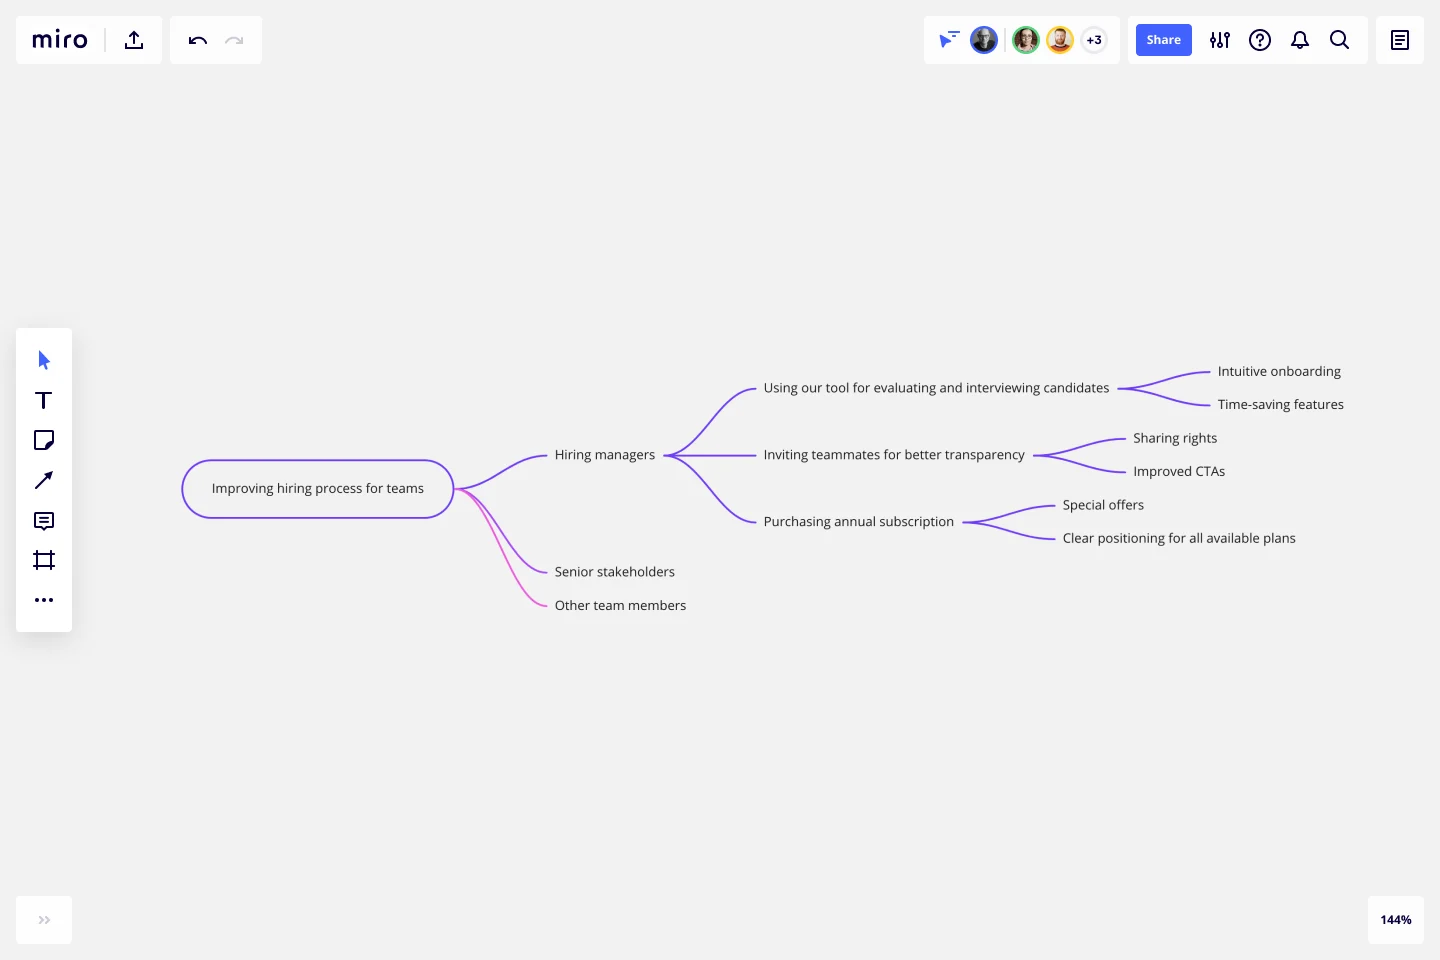
Impact mapping is a strategic planning technique. It allows organizations to stay on track while building products and shipping goods and services. An impact map is a graphical representation of your goals and the steps you must take to deliver on them. By creating an impact map, you can clearly communicate with your teammates, align on business objectives, and build better roadmaps.
When building products or working on projects, it can be easy to lose sight of your role within the broader organization. But your projects have a dynamic relationship with everything else in the organization, including other projects, teams, products, and functions. Many planning techniques lack this big-picture view. Impact maps, by contrast, help you visualize the relationship between your project roadmaps and the rest of your organization. You can therefore capture key assumptions and scope so you can deliver solutions without waste or over-engineering.
When should you use Impact Mapping?
You can use Impact Mapping to help you decide what should be in a product, prove to a client that it’s not worth investing in a particular feature and plan your next sprint or release. You can also use Impact Mapping for any type of project planning.
What are the key steps of Impact Mapping?
Impact Mapping is generally broken into 4 key steps: setting and describing business goals, identifying the personas, defining the actions these personas will take, and brainstorming the deliverables that will prompt these actions to take place.
How do you create an Impact Map?
Creating an impact map is simple and easy to do if you follow these steps. You can use our Impact Mapping Template and discuss everything with your team in real-time using Miro’s virtual collaboration platform.
Step 1: Decide on your goals
Start by drawing a box that contains your goal. Why are we doing this project? What do we hope to achieve?
Step 2: Identify the actors
Draw a branch that links your goal to your next box: the actors. Who can produce the effect we’re looking for? Who can obstruct who? Who are our customers or users? Who will be impacted by our goal? Many people choose to have a box for each actor. Connect each box to your goal.
Step 3: Determine the impacts or actions
The second branch brings the impact of your goal into sharper focus. How should our actors’ behavior change as a result of this goal? How can they help us achieve our goal? How might they prevent us from achieving our goal? Draw a box for each potential impact and connect them to your actors.
Step 4: Define the deliverables
Once you have answered those questions, you can start thinking about the scope of your project. The third branch of the map deals with deliverables. What can we do to increase the likelihood that this goal will be achieved? How do we support the desired impact? These are your deliverables -- what you can hope to achieve within the scope of this project.
Get started with this template right now.
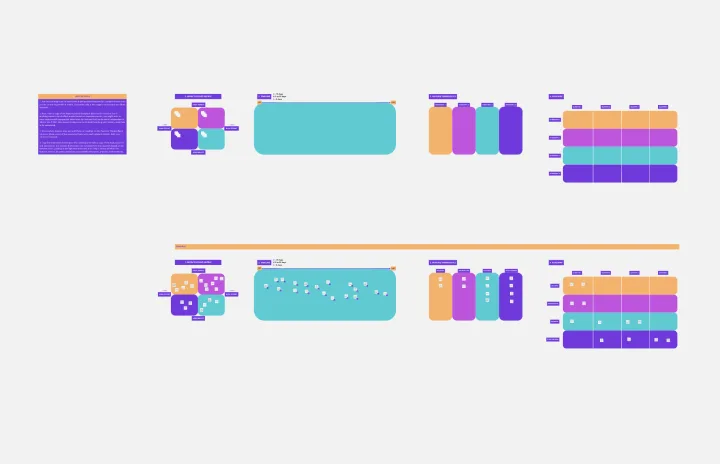
Epic & Feature Roadmap Planning
Epic & Feature Roadmap Planning template facilitates the breakdown of large-scale initiatives into manageable features and tasks. It helps teams prioritize development efforts based on business impact and strategic objectives. By visualizing the relationship between epics and features, teams can effectively plan releases and ensure alignment with overall project goals and timelines.
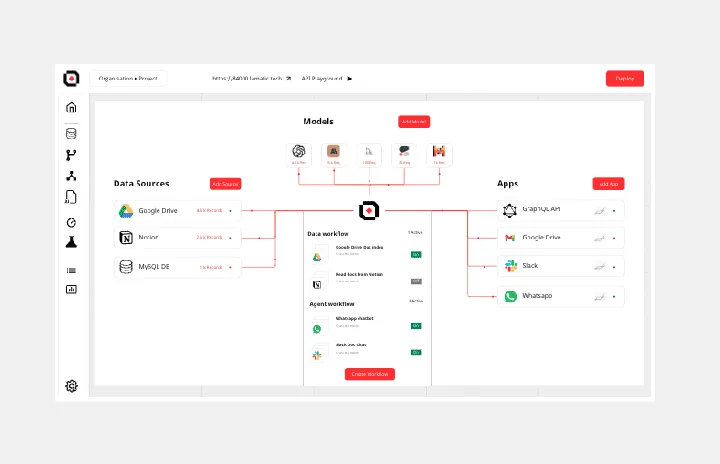
GenAI Application Workflow
Works best for:
Flowcharts, Mapping, Diagrams
The GenAI Application Workflow template is a visual tool for mapping out the workflow of applications developed using GenAI. It provides elements for defining process steps, decision points, and data flows within the application. This template enables developers and project teams to visualize the application workflow, identify potential bottlenecks, and optimize the user experience. By promoting clarity and efficiency in application development, the GenAI Application Workflow empowers teams to deliver innovative and user-friendly applications effectively.
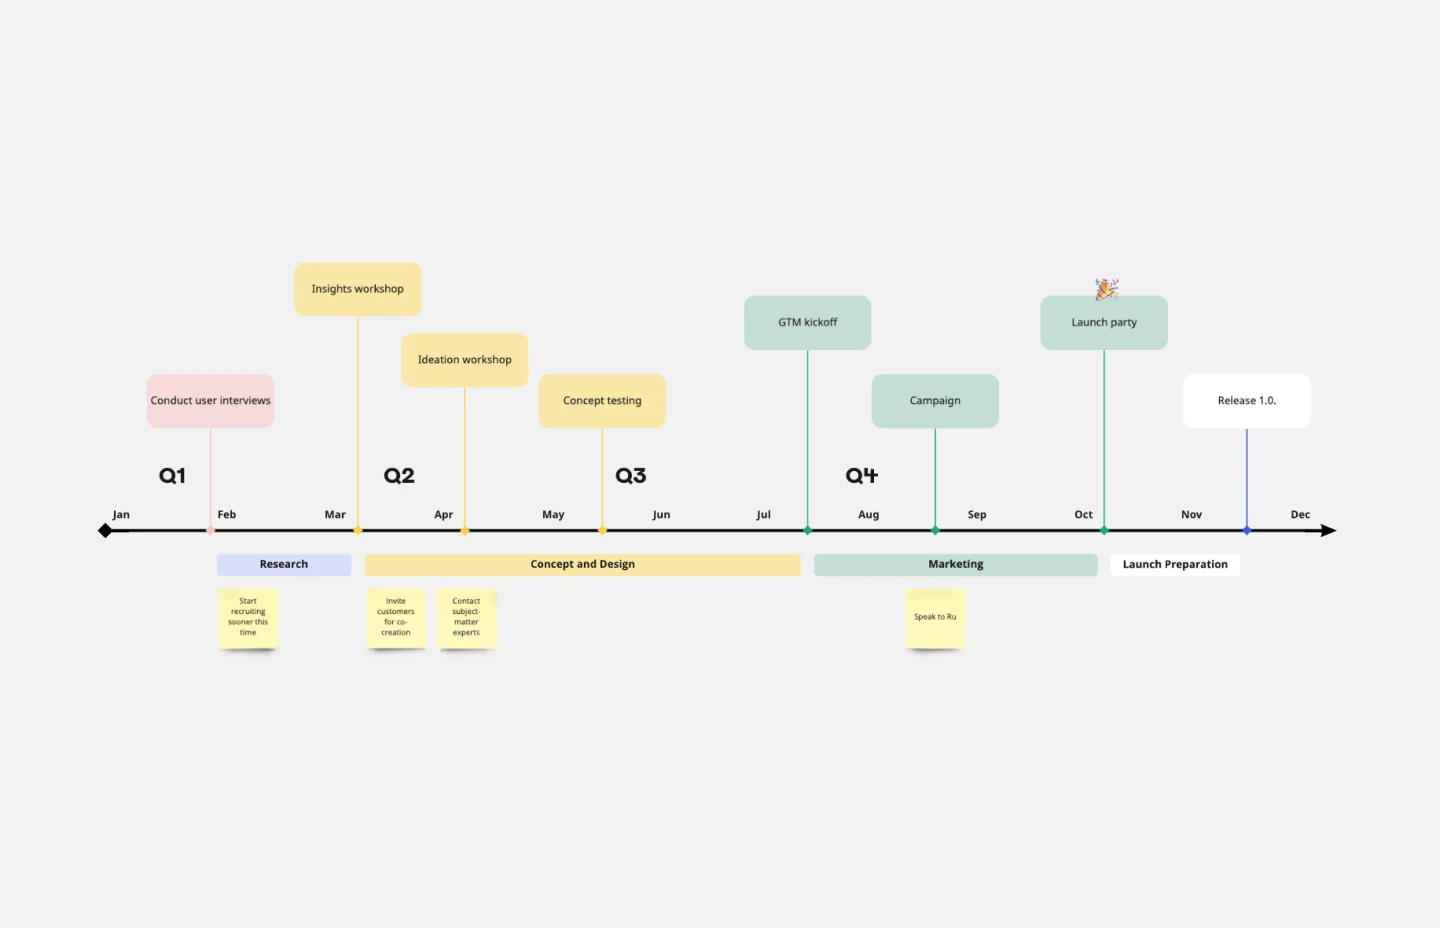
Timeline Template
Works best for:
Project Management, Flowcharts, Project Planning
A timeline displays a chronological order of important dates, and scheduled events. Timelines help product managers, project managers, and team members tell visual stories about progress and obstacles. Timelines enable teams to see at a glance what happened before, what progress is happening now, and what needs tackling in the future. Projects or products with specific purpose or deliverables should be based on a timeline to be successful. Use the timeline as a shared reference for start dates, end dates, and milestones.
Screen Flow Template
Works best for:
UX Design, Product Management, Wireframes
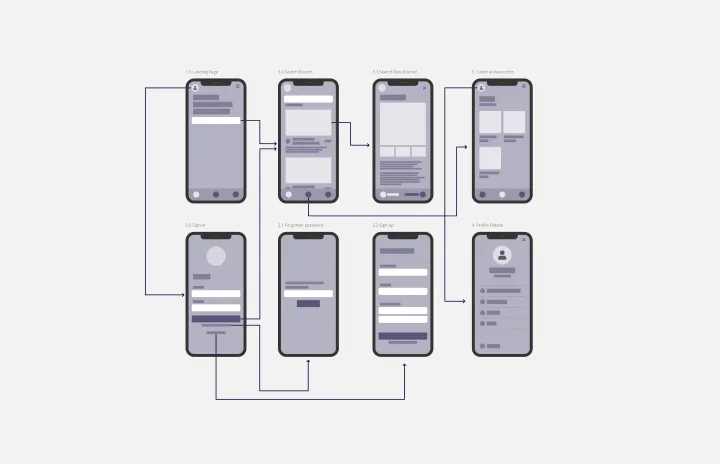
A screen flow (or wireflow) brings together a multi-screen layout that combines wireframes with flowcharts. The result is an end-to-end flow that maps out what users see on each screen and how it impacts their decision-making process through your product or service. By thinking visually about what your customers are looking at, you can communicate with internal teams, stakeholders, and clients about the decisions you’ve made. You can also use a screen flow to find new opportunities to make the user experience frictionless and free of frustration from start to end.
Kubernetes Architecture Diagram Template
Works best for:
Software Development, Diagrams
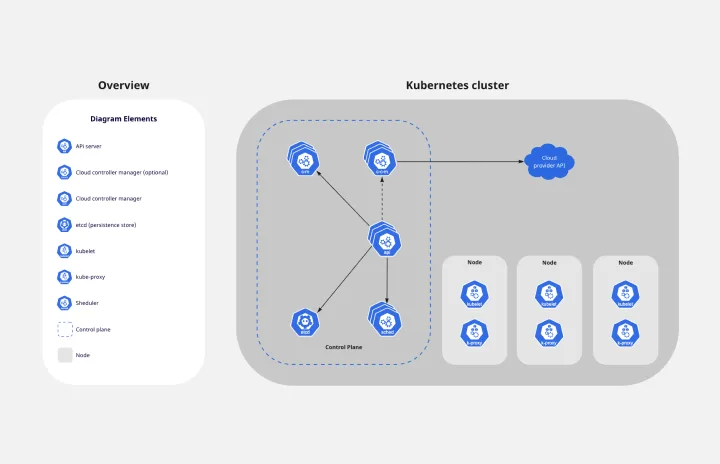
Use the Kubernetes Architecture Diagram template to manage your containerized applications better and bring your apps’ deployment, management, and scalability to the next level. This template helps you lower the downtime in production and allows you to have a more agile app production. Improve the deployment of your apps by visualizing every step of the process with the Kubernetes Architecture template. Try it out, and see if it works for you and your team.
T-Chart Template
Works best for:
Ideation, Operations, Strategic Planning
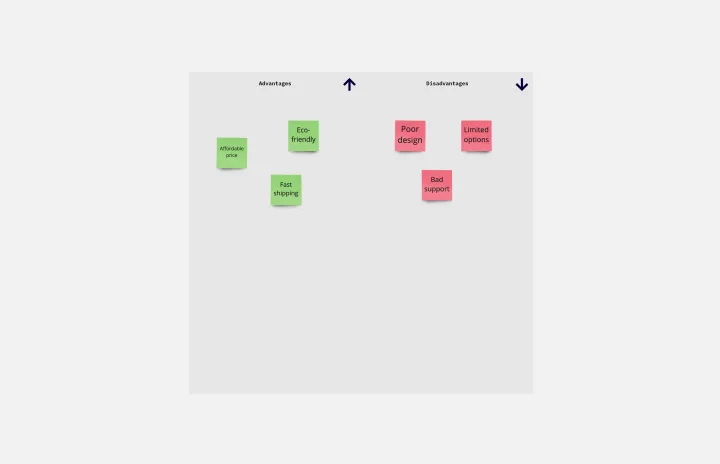
T-Charts can help you compare and contrast two different ideas, group information into different categories, and prove a change through “before” and “after” analysis. T-Charts are visual organizational tools that enable you to compare ideas, so you can evaluate pros and cons, facts and opinions, strengths and weaknesses, or big-picture views versus specific details. Designers and content creators can use T-Charts to turn possibilities into actionable ideas. T-Charts are useful for discussing differences and similarities with your team or clients and can help you to reach a decision together.