Google Cloud Architecture Diagram Template
Visualize the deployment of your applications with Google Cloud Architecture Diagram template and optimize your processes.
Trusted by 65M+ users and leading companies


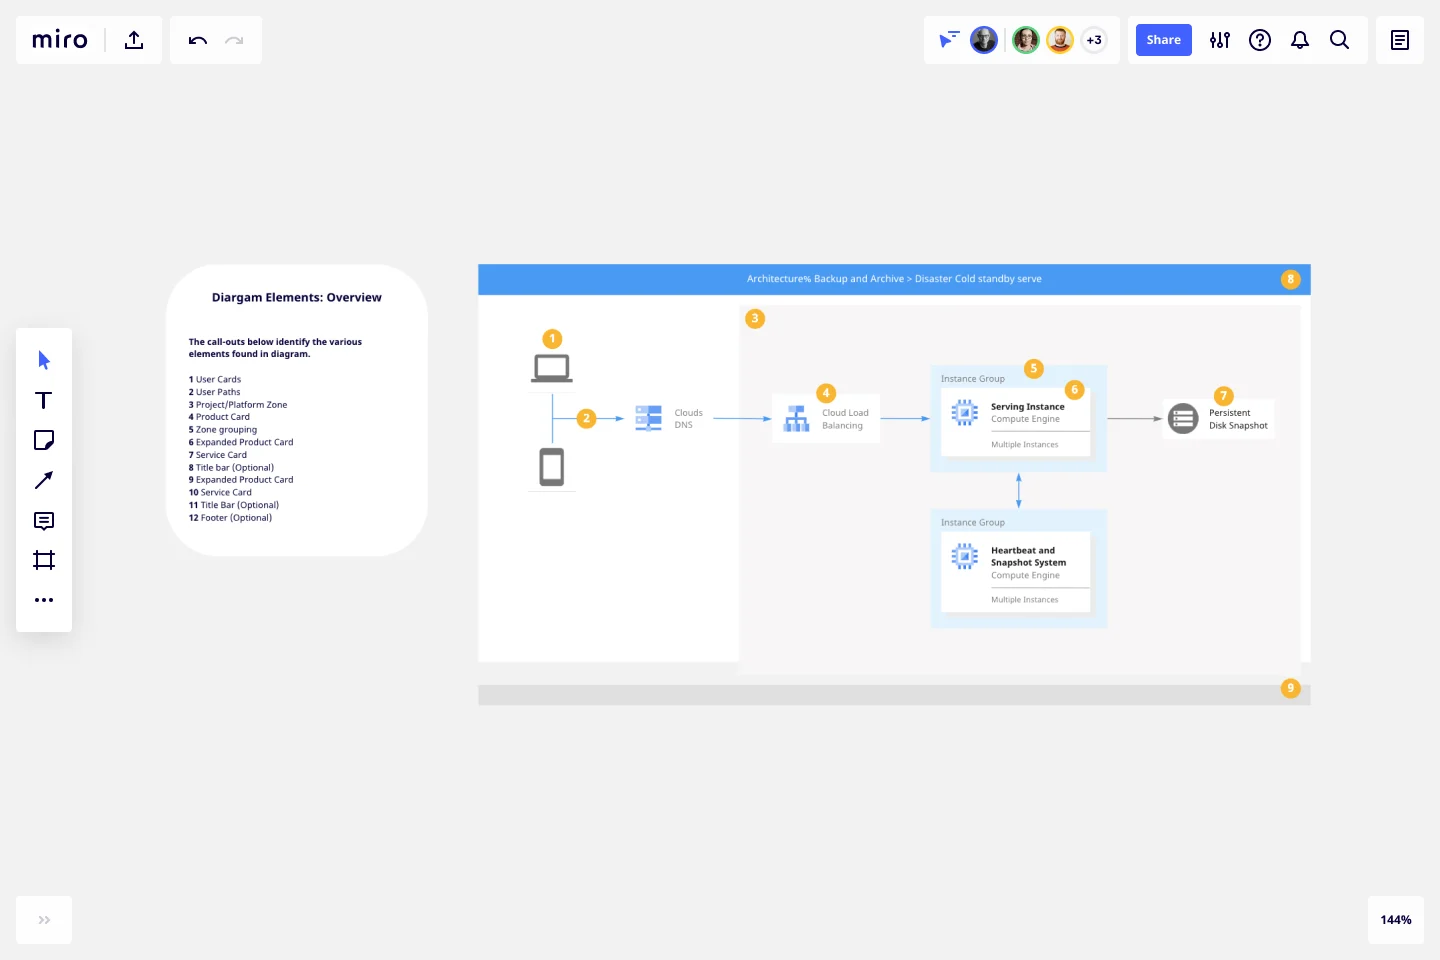
About the Google Cloud Architecture Diagram Template
A Google Cloud Architecture Diagram template is where you can visually represent and manage application development, deployment, and documentation. You can use this Google Cloud Architecture Diagram template to stay in sync with your team, have an excellent application architecture overview, and quickly iterate if needed.
Keep reading to learn more about the Google Cloud Architecture Diagram Template.
GCP Architecture diagram for network optimization
Developers and IT managers use the Google Cloud Architecture Diagram template to make changes and accurately document the network infrastructure.
The GCP Architecture Diagram also allows people to quickly understand your Google Cloud architecture’s network design and operation, facilitating communication across your organization.
How do I create a Google Cloud Architecture Diagram template?
A Google Cloud Architecture Diagram template allows you to visualize the management of apps.
To create a basic Google Cloud Architecture Diagram template with Miro, you can follow these steps:
List your Google Cloud Architecture components, using our set of Google Cloud Icons.
Organize your diagram by adding in the components of the network..
Add connection lines between the component shapes and set the arrows in the direction of the flow.
Format and customize your Google Cloud Architecture Diagram template with shapes and frames.
In Miro, you can quickly build a GCP Diagram from scratch using our design tools and icons set, or use our Google Cloud Architecture Diagram template and customize it as you see fit.
If you are interested in creating other network diagrams, Miro is the perfect network diagram tool with several available shape packs and templates to suit your needs.
What is Google Cloud Platform used for?
The Google Cloud Platform is used to make network management and development of network infrastructure accessible and flexible, allowing organizations to create cloud-native apps and manage and analyze data quickly. The Google Cloud Platform helps you navigate many services categories from computer networks to storage and database.
How do I draw a Google cloud architecture?
There are many ways you can draw a Google Cloud Architecture Diagram with Miro. You can either use our template or draw your GCP diagram from scratch. Follow these steps to draw your Google Cloud Architecture Diagram in Miro: select which GCP icons to use for your diagram from Miro’s Google Cloud Platform component library. Next, use connector lines and other shapes to outline and describe your network, and lastly, add arrows to represent the flow of information.
Get started with this template right now.

Cross Functional Flowchart
Works best for:
Org Charts, Business Management
Have a quick look at everyone on a project and see exactly what they’ll contribute. That’s the clarity and transparency a cross-functional flowchart will give you. These are also called “swim lane” flowcharts because each person (each customer, client, or representative from a specific function) is assigned a lane—a clear line—that will help you visualize their roles at each stage of the project. This template will empower you to streamline processes, reduce inefficiencies, and make meaningful cross-functional relationships.
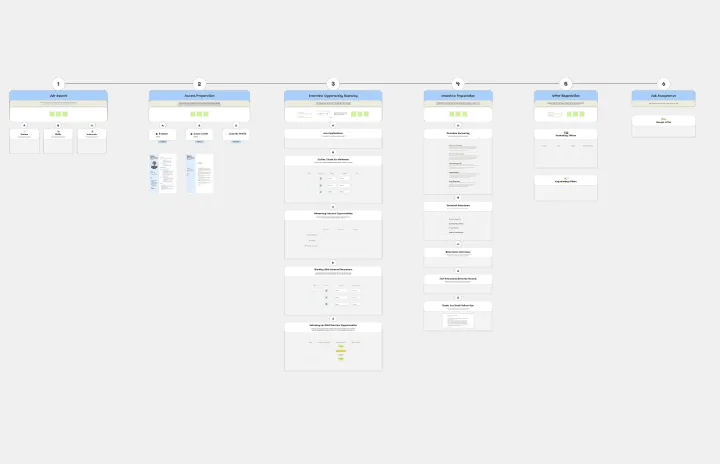
Job Search Process Diagram
Works best for:
Diagramming
The Job Search Process Diagram template offers a visual tool for mapping out the steps and stages involved in the job search process. It provides a structured framework for organizing tasks, tracking progress, and managing resources. This template enables job seekers to streamline their job search efforts, stay organized, and increase their chances of success. By promoting clarity and efficiency, the Job Search Process Diagram empowers individuals to navigate the job market effectively and achieve their career goals.
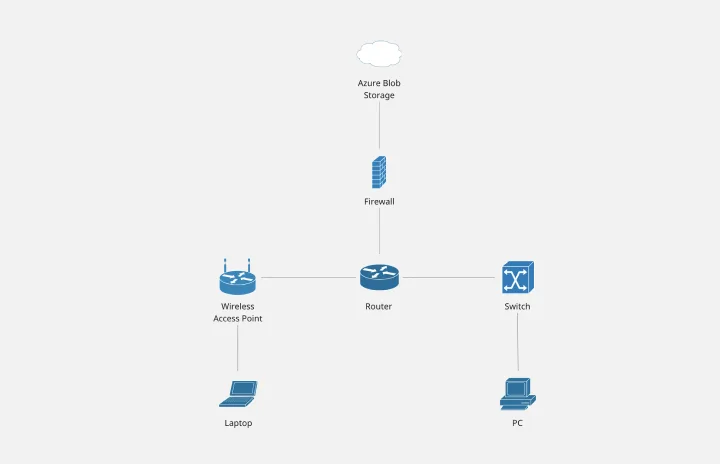
Cisco Network Diagram Template
Works best for:
Software Development, Diagrams
Cisco offers data center and access networking solutions built for scale with industry-leading automation, programmability, and real-time visibility. The Cisco Data Network Diagram uses Cisco elements to show the network design of Cisco Data Networks visually.
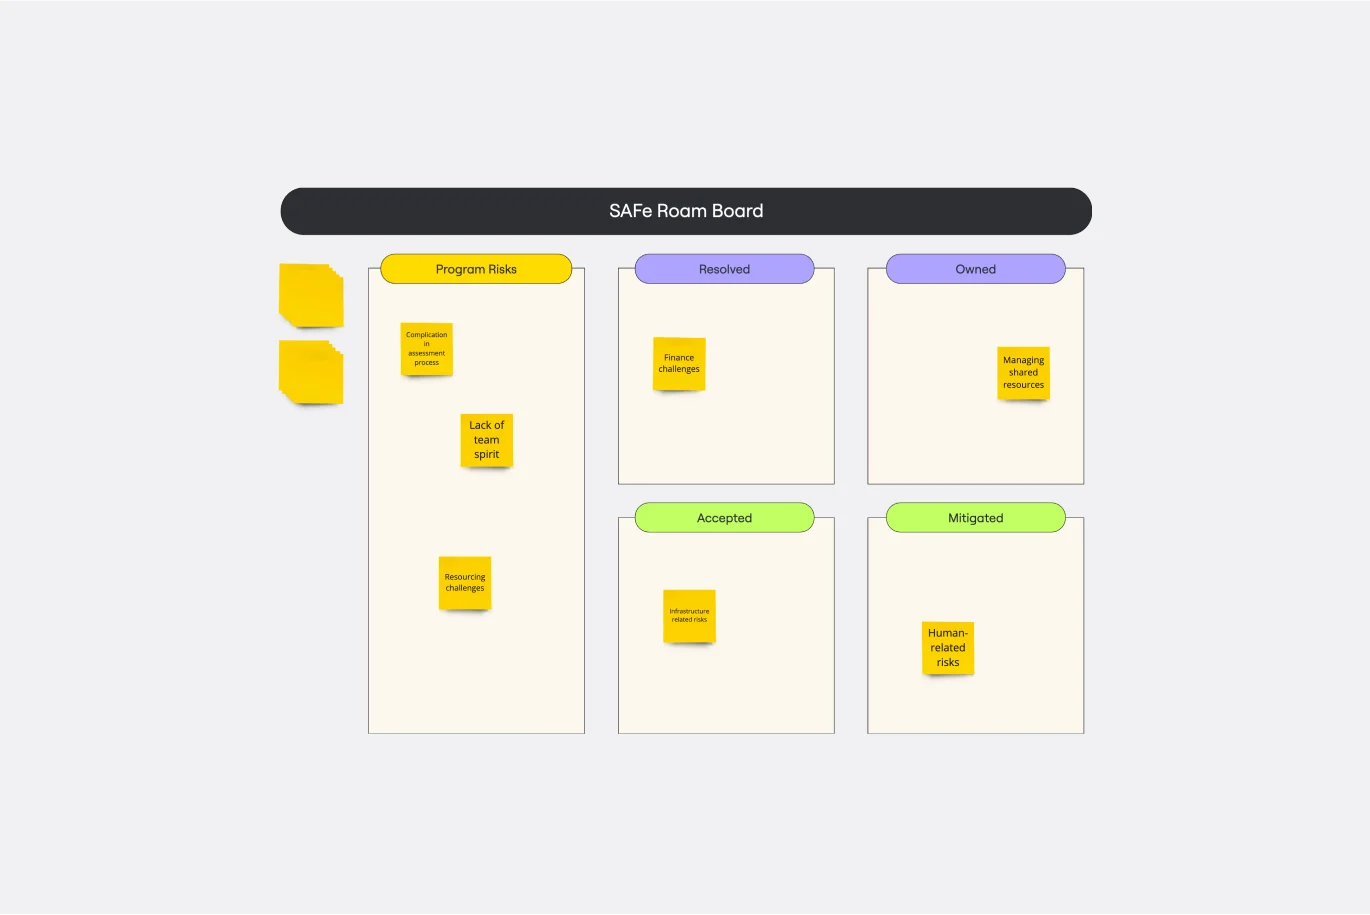
SAFe Roam Board
Works best for:
Agile Methodology, Operations, Agile Workflows
A SAFe ROAM Board is a framework for making risks visible. It gives you and your team a shared space to notice and highlight risks, so they don’t get ignored. The ROAM Board helps everyone consider the likelihood and impact of risks, and decide which risks are low priority versus high priority. The underlying principles of SAFe (Scaled Agile Framework) are: drive cost-effective solutions, apply systems thinking, assume that things will change, build incrementally, base milestones on evaluating working systems, and visualize and limit works in progress.
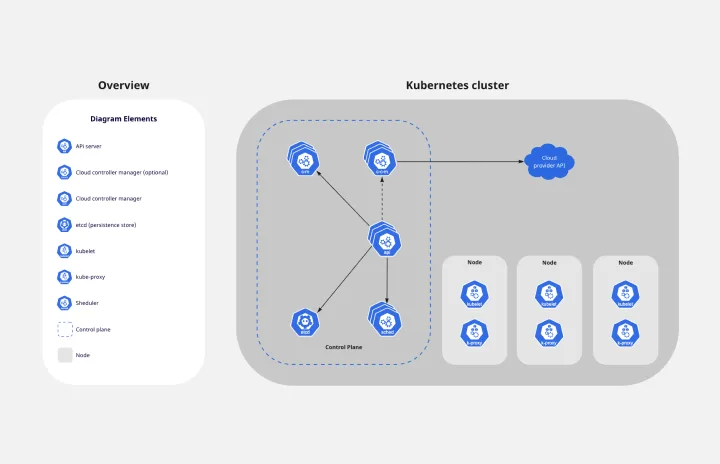
Kubernetes Architecture Diagram Template
Works best for:
Software Development, Diagrams
Use the Kubernetes Architecture Diagram template to manage your containerized applications better and bring your apps’ deployment, management, and scalability to the next level. This template helps you lower the downtime in production and allows you to have a more agile app production. Improve the deployment of your apps by visualizing every step of the process with the Kubernetes Architecture template. Try it out, and see if it works for you and your team.